AddonPulse
See exactly where your CPU time and memory go — per addon. AddonPulse turns
Blizzard's built-in profiler into a sortable, filterable live table with history
graphs, leak detection, and recording that survives reloads — so you can close
it during a pull and review the whole fight afterward.
If your frames are dropping and you don't know which addon to blame, this tells
you.
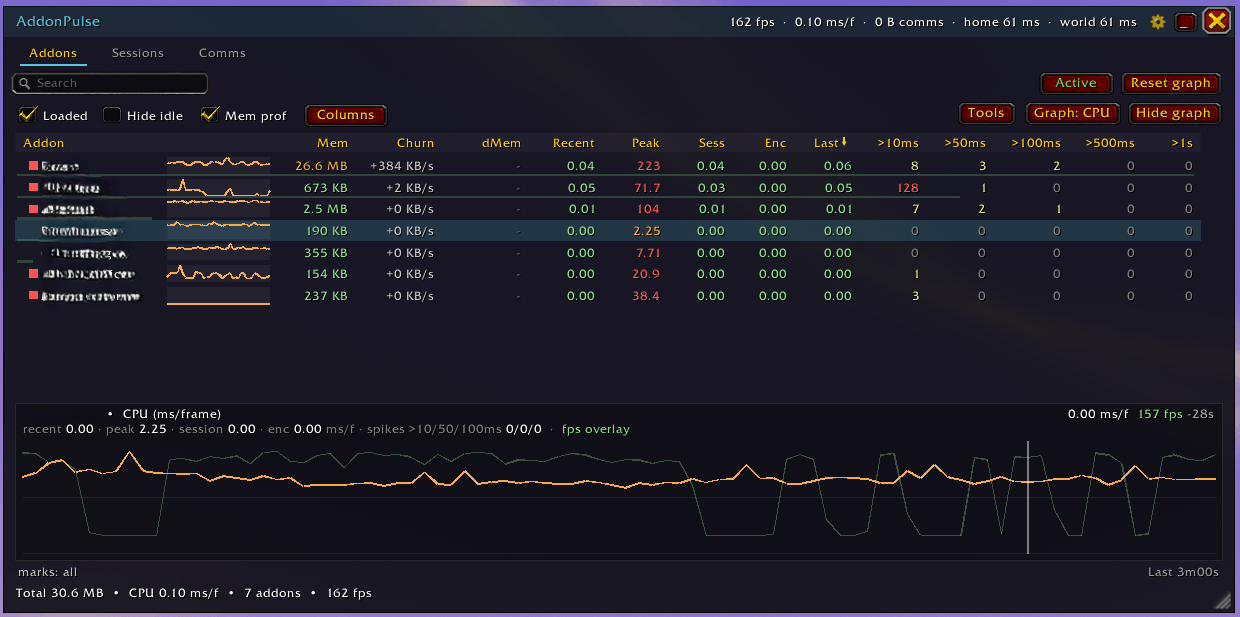
What it shows
A live table of every installed addon. Click any column to sort, type to filter
by name, and pick exactly the columns you want:
- Mem — Lua memory the addon is holding right now.
- Recent / Peak / Sess / Enc / Last — CPU per frame from the native profiler:
the live load, the worst frame, the session and current-boss averages, and the
most recent frame. Read it in milliseconds or as a percentage of your frame
budget.
- >10 / >50 / >100 / >500 ms / >1s — how many frames the addon blew past each
threshold this session.
- dMem — memory growth since you set a baseline (see below).
Two status dots flag trouble at a glance: orange = memory climbing like a
leak, red = it spiked over 10 ms in a frame. Click a row to pin it to a
detail graph that plots its history, marks combat / pulls / deaths, and puts
a red tick on every frame it stuttered.
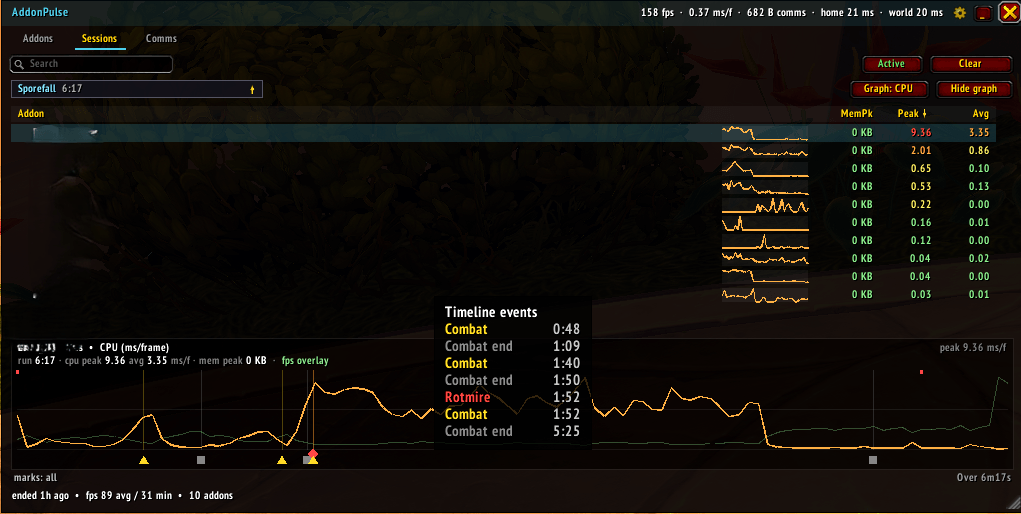
Sessions — recorded and reload-proof
AddonPulse keeps sampling while it's closed or minimised, and snapshots every
fight (named after the boss, tagged with difficulty and Kill / Wipe) and
every whole dungeon or raid (Mythic+ runs show their key level). Each
session also records the frame rate over time, overlaid on the graph, so you
can see an addon's CPU spike line up with the real FPS dip. Close the window
before a pull, open it afterward — even after the post-key reload — and review
the full timeline on the Sessions tab. Old sessions rotate out automatically
so your saved data never balloons.
Find a memory leak
Hit Set baseline, play for an hour, then read the dMem column: anything
that ballooned is your leak (or at least your memory hog); anything at zero is
behaving. Pin the addons you watch to the top and ignore the ones you
don't.
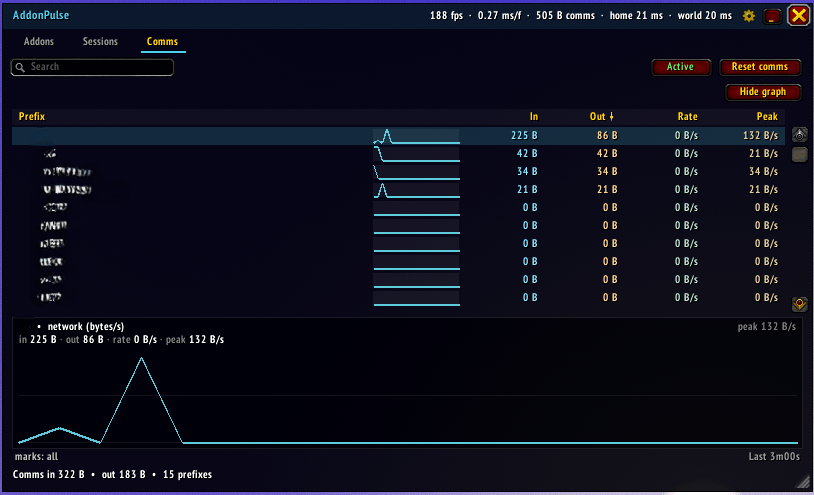
Comms
A per-prefix breakdown of addon-message traffic: total bytes in/out, a live
rate and peak burst, and a traffic graph over time — so you can see
exactly when an addon floods the network (a raid-join sync storm jumps right
out) instead of staring at a running total. The tooltip adds a channel breakdown
(Party / Raid / Guild / Whisper / Instance) and the average message size.
Keeps itself cheap
A performance monitor has no business being a performance problem:
- CPU comes from the always-on native profiler, so reading it costs
microseconds — no reload, no console variable.
- The only expensive part is the per-addon memory scan, so it runs on a slow
cadence, only while the window is open, and is paused during combat by
default (it can't be made async — WoW's Lua is single-threaded). Don't want it
at all? One click turns the memory profiler off for pure CPU monitoring.
- Pause AddonPulse and only a lightweight title-bar readout keeps running —
the minimised bar doubles as a compact FPS / CPU / memory monitor.
Open and control
/pulse (or /ap), the minimap button (right-click to pause), or the
addon-compartment entry opens the window./pulse options, the title-bar cog, or Game Menu → Options → AddOns →
AddonPulse opens the settings — sample rates, session limits, display units,
window scale / opacity, and a Reset to Defaults.
Compatibility
WoW Midnight — patch 12.0.7 and 12.1. Bundles only the standard
minimap-button libraries; no other dependencies. Settings are account-wide;
recorded sessions and the memory baseline are saved per character.