Performance Metrics (FPS Monitor)
- By
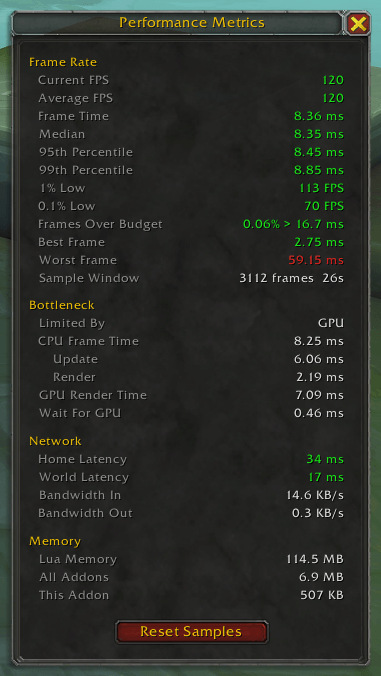
A movable window showing live frame rate percentiles, CPU/GPU bottleneck breakdown, network latency, and addon memory use - so you can measure whether a setting change actually helped.
Description
Performance Metrics is a lightweight diagnostic window for measuring your game's real performance, not just an FPS counter, but the numbers that actually explain a stutter: frame time percentiles, whether you're CPU- or GPU-bound, network latency, and addon memory usage, all in one movable panel.
Why percentiles instead of just FPS
Average FPS hides the stutters that actually ruin a pull. A single 200ms freeze barely moves your average, but it's the thing you felt. Performance Metrics tracks the full distribution of your frame times so you can see:
- 1% Low and 0.1% Low - how bad your worst frames actually are, not just your average
- 95th / 99th percentile frame times
- Frames Over Budget - the percentage of frames that missed your target frame time
- Best / Worst frame in the current sample window
Bottleneck breakdown
Pulls the engine's own CPU/GPU timing (via GxFrameStats) to tell you whether you're CPU-bound or GPU-bound, and breaks the CPU frame down into Update vs. Render time, plus GPU render and wait time — so you know which setting is actually worth changing.
Also included
- Network - home and world latency, bandwidth in/out
- Memory - Lua memory, total addon memory, and this addon's own footprint
- A Reset Samples button so you can clear the history right after changing a setting and get a clean read
- A draggable window that remembers its position between sessions
- Slash commands:
/pmor/performancemetricsto toggle the window
Zero cost when closed
Sampling is tied entirely to the window's visibility - nothing runs, and no memory is held, while it's closed. Open it, make a change, hit Reset Samples, and compare.
The Performance Metrics (FPS Monitor) Team


Owner