Load Profiler
- By
Find out which addons make your loading screen slow. Times every addon at login, with memory use.
screenshot-2026-10-03-104348-png.png
Description
Why is my loading screen so slow?
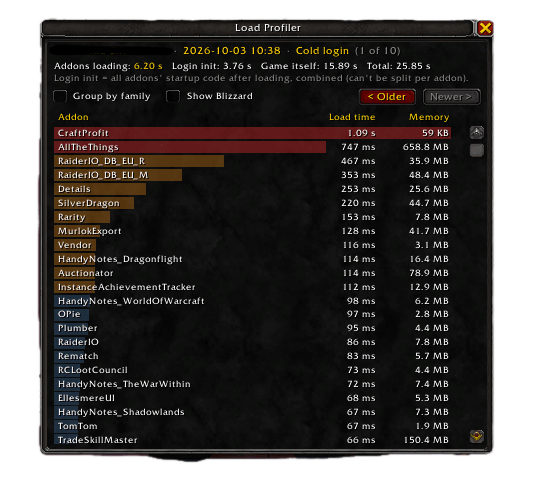
Load Profiler answers that. It times every addon as it loads at login and shows a ranked list, slowest first, with each addon's memory use.
Features
- Load time and memory for every addon, sorted slowest first, with colored bars.
- Login split into three parts: addons loading, addons' startup code, and the game's own loading. You see how much of your loading screen your addons actually cost.
- Group by family: add up related addons (all DBM modules, all HandyNotes plugins…).
- History: keeps your last 10 logins, so you can compare before and after turning addons off.
- Chat summary of the 5 slowest addons after each login.
- Practically free: its own cost is under a millisecond.
How to use
- Log in. Chat shows your total addon load time and the slowest addons.
- Type /lp to see the full list.
- Turn off what you don't need on that character, log in again and compare.
Tip: to see how fast WoW loads with no addons, log in once with only Load Profiler enabled.
Commands
- /lp: open or close the window
- /lp reset: clear the history
Good to know
- Compare cold logins, not /reload. A reload reads cached files and is much faster. Each session is labeled.
- Some setup time shows on the next addon. Many addons do heavy setup right after they load, and that time lands on the addon loaded after them. If a tiny addon shows a big number, check the one before it.
- Startup code can't be split per addon. The game gives no way to see whose code ran when, so that part is shown as one total.
The Load Profiler Team