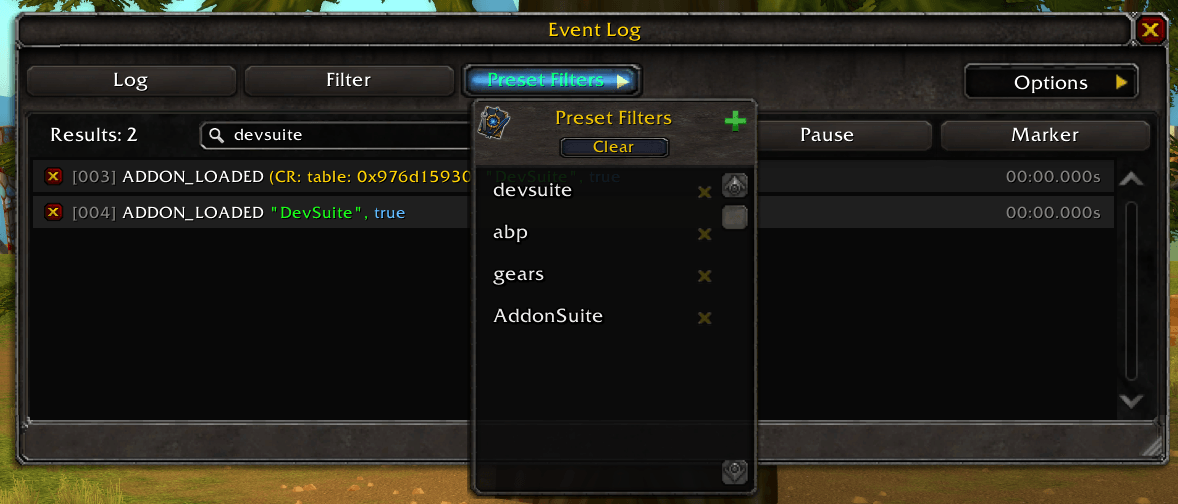
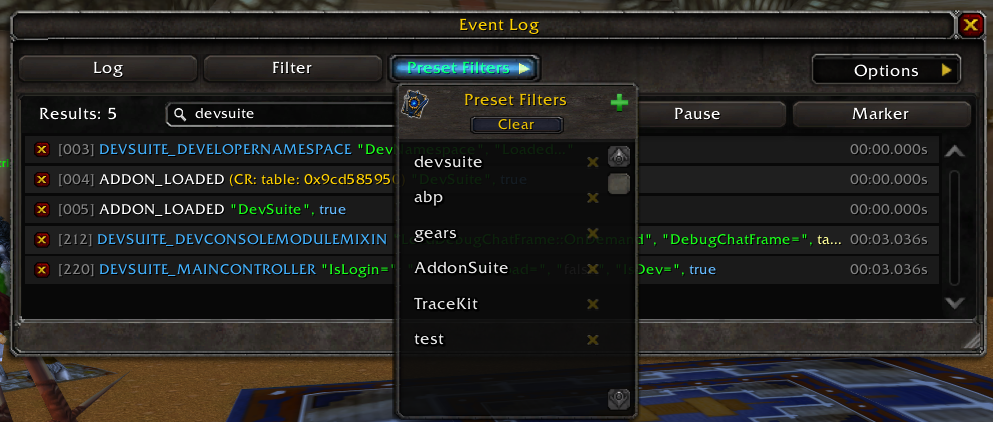
Click to view and manage your saved filter presets for the Event Trace UI. Select any preset to instantly apply its filter to the trace log. You can also add new presets or delete existing ones with ease.
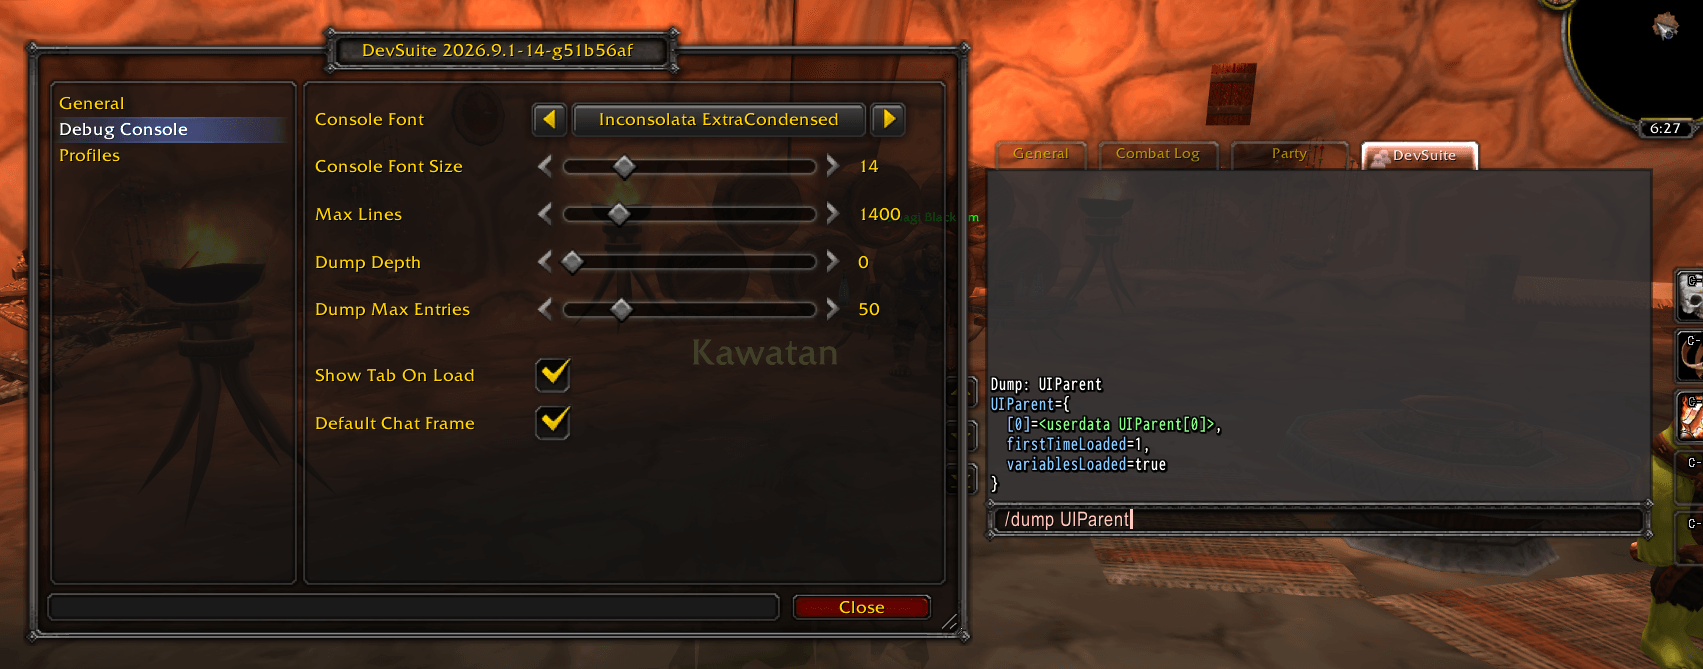
/dump output goes to its own DevSuite chat tab in a monospaced console font. Set the font, size, max lines and dump limits from the Debug Console options.
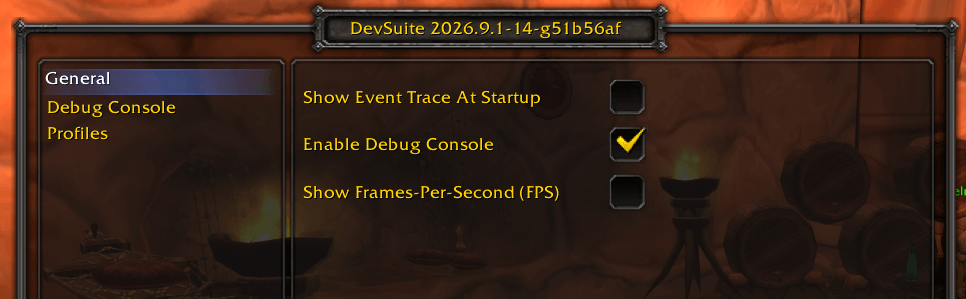
General options: open Event Trace at startup, turn on the Debug Console chat tab (requires DebugChatFrame), and show the frames-per-second counter.
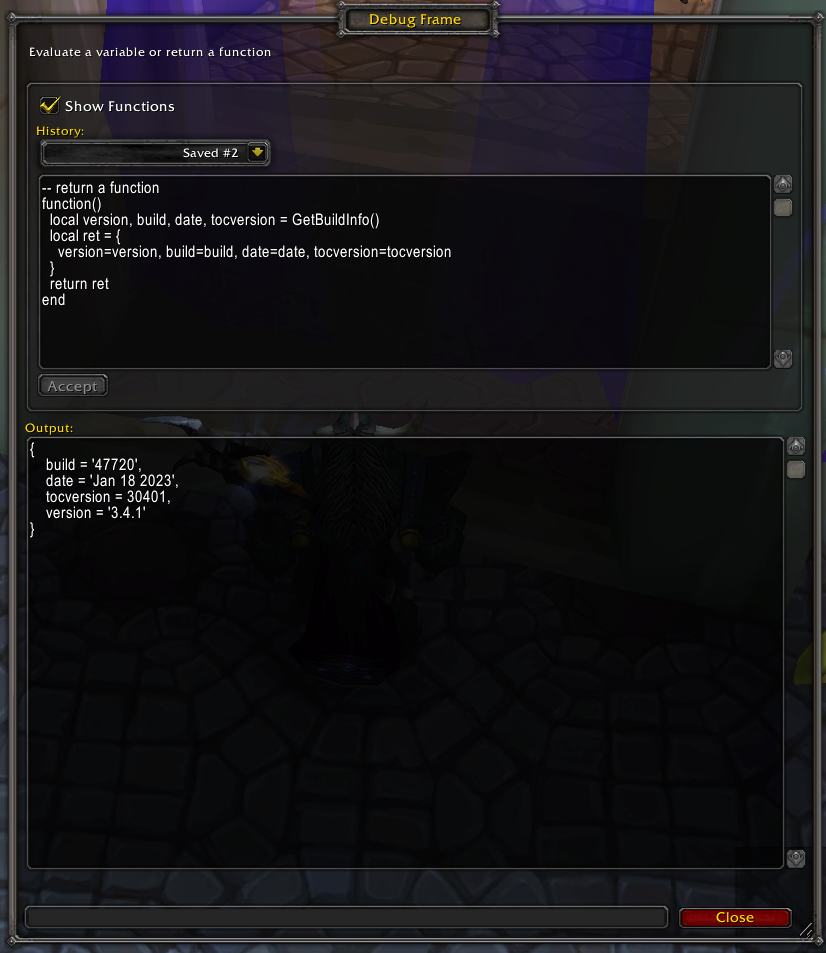
Enhance your Lua scripting capabilities by creating a custom function that incorporates sophisticated logic.
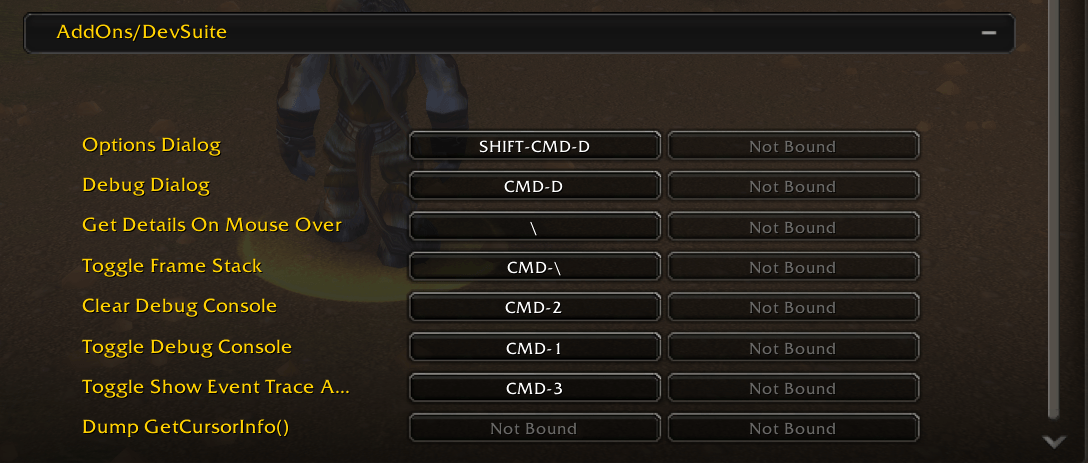
DevSuite adds handy keybindings for everyday developer tasks. For example, press a key while hovering over any UI frame to instantly open a details dialog with full information about that frame — making inspection and debugging quicker and easier.
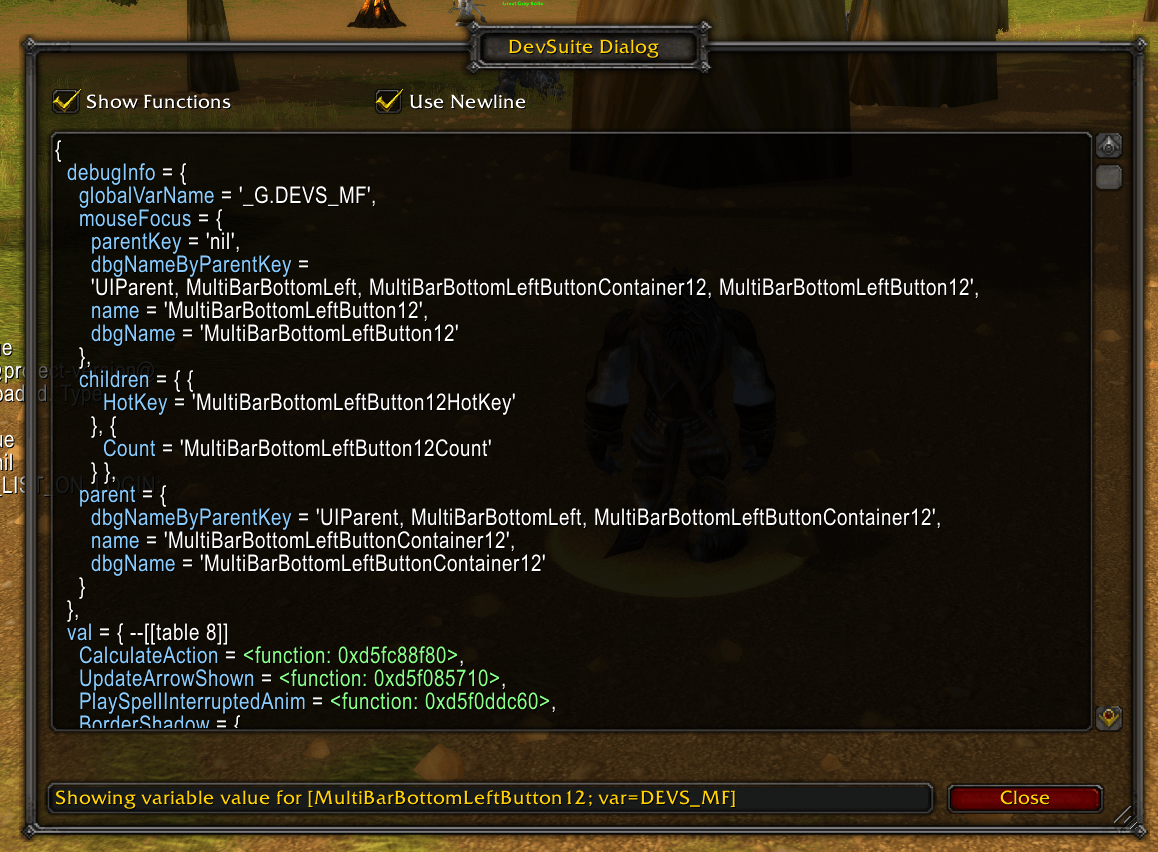
With a keybinding assigned, the 'Get Details on Mouse Over' feature swiftly evaluates any UI component under your cursor, making it one of my top favorite features for its simplicity and efficiency. The mouseover target is assigned to a global variable.
Description
DevSuite
▶︎ The developer tool your WoW addons deserve.
Releases | Known Issues | CurseForge
Description
DevSuite is a toolkit for World of Warcraft addon developers, offering an intuitive debug dialog UI, event tracing, frame inspection, and other tools to streamline debugging and optimize your add-on development workflow.
Highlights
- In-game Lua eval dialog — test snippets and inspect return values without leaving WoW.
- Global
tr(...)tracing function (via LibTraceKit) plus/etraceevent tracing — see what's firing, when. - "Get Details on Mouse Over" — inspect any UI frame/widget just by hovering.
- Toggle Blizzard's Frame Stack tool via keybind — no more typing
/fstack. - Ready-made preset filters for
/etrace— cut through event noise fast. - Save and switch between up to 15 debugging sessions effortlessly.
- Automated FPS display for performance monitoring.
- Dedicated Debug Chat Frame tab (via DebugChatFrame) for a clean, filterable log console.
/devsuiteslash commands for quick access to the debug dialog, config, and console.Dump Cursor Infokeybind for inspecting spells, macros, and mounts under your cursor.- Ace3 profile support for per-character/per-spec dev settings.
- Key actions (Debug Dialog, Get Details On Mouse Over, Toggle Frame Stack, and more) can be bound to keys via WoW's native Key Bindings UI.
Key Features
Debug UI Evaluation Tool
Evaluate Lua on the fly and save the snippets you use often. Switch between up to 15 saved debugging sessions, so you're not rewriting the same throwaway code every time you reload.
Tracing with LibTraceKit
Call the global tr(...) function anywhere in your code to emit tagged trace output to the trace UI — no need to wire up your own logging.
Syntax: tr('<tag-name>', ...)Example:
tr('EventListener', 'var1=', var1, 'tableVal=', fmt({ 1, 2, 3 }))Open the trace UI (/etrace) and filter for DEVSUITE to see the trace line:
DEVSUITE_EVENTLISTENER "var1=" "<value>", etc...
Preset Filters for /etrace
Filter WoW's event stream with ready-made presets instead of typing event names by hand. Jump straight to the events you care about and cut out the noise when watching /etrace output.
Get Frame On Mouse Over
Hover over any UI element to identify the exact frame beneath the cursor, with its details surfaced instantly. No more guessing frame names or digging through /fstack output by hand.
Toggle Frame Stack
Bind a key to instantly bring up Blizzard's Frame Stack tool — no more typing /fstack every time you need it. Frame Stack shows you the full frame hierarchy under your cursor, including frame names, sizes, and layers, which makes it invaluable for tracking down anchor issues, taint sources, and z-order/click-through problems while you iterate.
Debug Chat Frame
Enable a dedicated Debug Chat Frame tab (requires the optional DebugChatFrame addon) to keep debug/trace output separate from your regular chat log. Configurable font size, max line count, and can be set as your default chat frame.
FPS Display
An always-available FPS readout for quick performance checks while you iterate.
Slash Commands
/devsuite (or /ds) [option]
  config    - Shows the config UI
  dialog    - Toggles the debug dialog UI
  clear     - Clears the debug console (aliases: cls, clr)
  info      - Prints additional info about the addon
  help      - Shows this help

/devsuite-options (or /ds-options) - Opens the Ace3 config command line options
Dump Cursor Info
Bind a key to Dump Cursor Info to inspect whatever's currently on your cursor — spell, macro, mount, or companion — and dump its details straight to your chat log. Handy for grabbing spell IDs and macro indices while you work.
Ace3 Profile Support
Your DevSuite settings follow Ace3 profiles, so per-character or per-spec configurations switch automatically with your profile.
Donations
If DevSuite has made your addon development easier, consider supporting its development:
About
- About the Author (Tony Lagnada)
- My AddOn Portfolio Can Be Found Here Curse Forge/Kapresoft
DevSuite Development Tool Team

Owner