GlymeraProfiler
- By
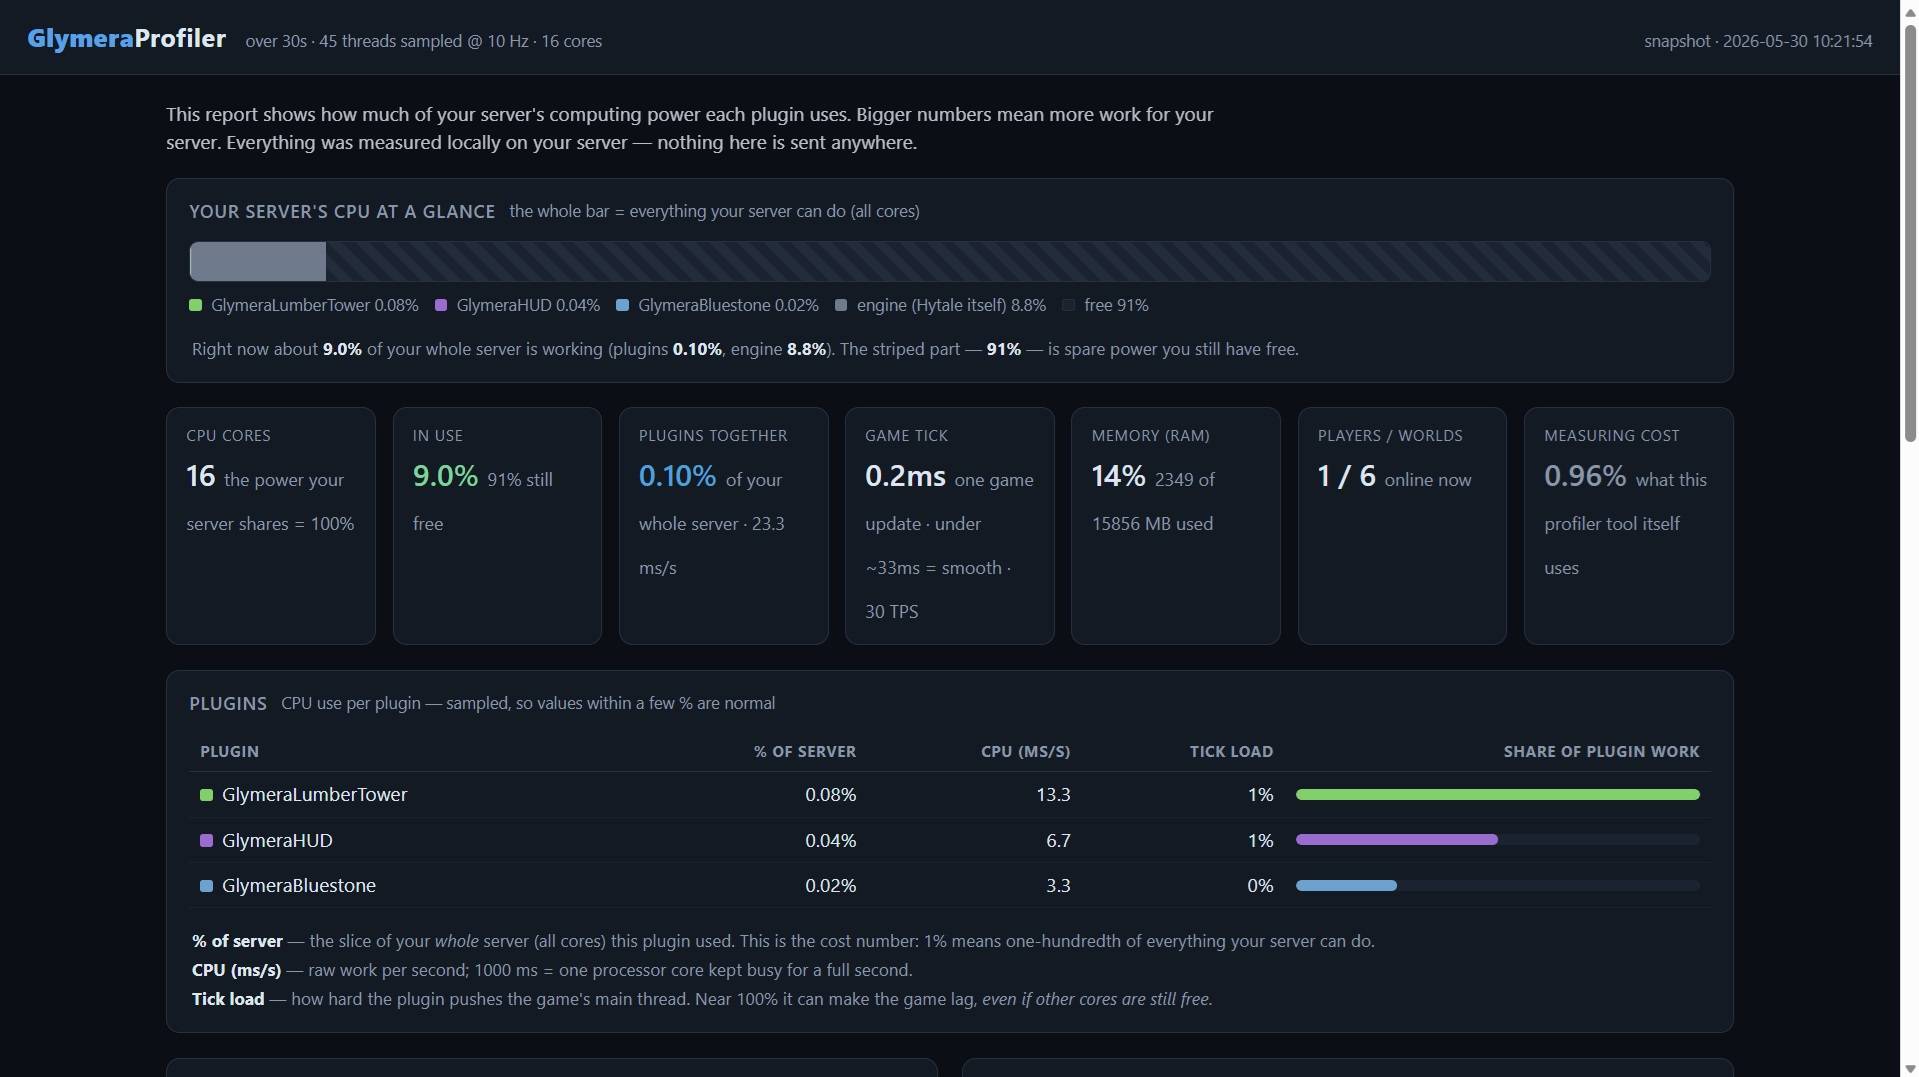
See which plugin is slowing your Hytale server. Run /glprof for a single local report.html: per-plugin CPU, % of server, Tick load and a flame graph. No open port, no uploads - nothing leaves your server.
Unbenannt_1.jpg
Unbenannt_2.jpg
Unbenannt_3.jpg
Unbenannt_4.jpg
Description
GlymeraProfiler
Which plugin is slowing down your Hytale server? Find out in 30 seconds — right in your browser. Local only: it never opens a port and never sends anything anywhere.
Most actual version only working for Hytale stable 5 ! Don't miss my other exciting projects — take a look at GlymeraCraft's Profile Discord: https://discord.gg/s5NRFWfxgy
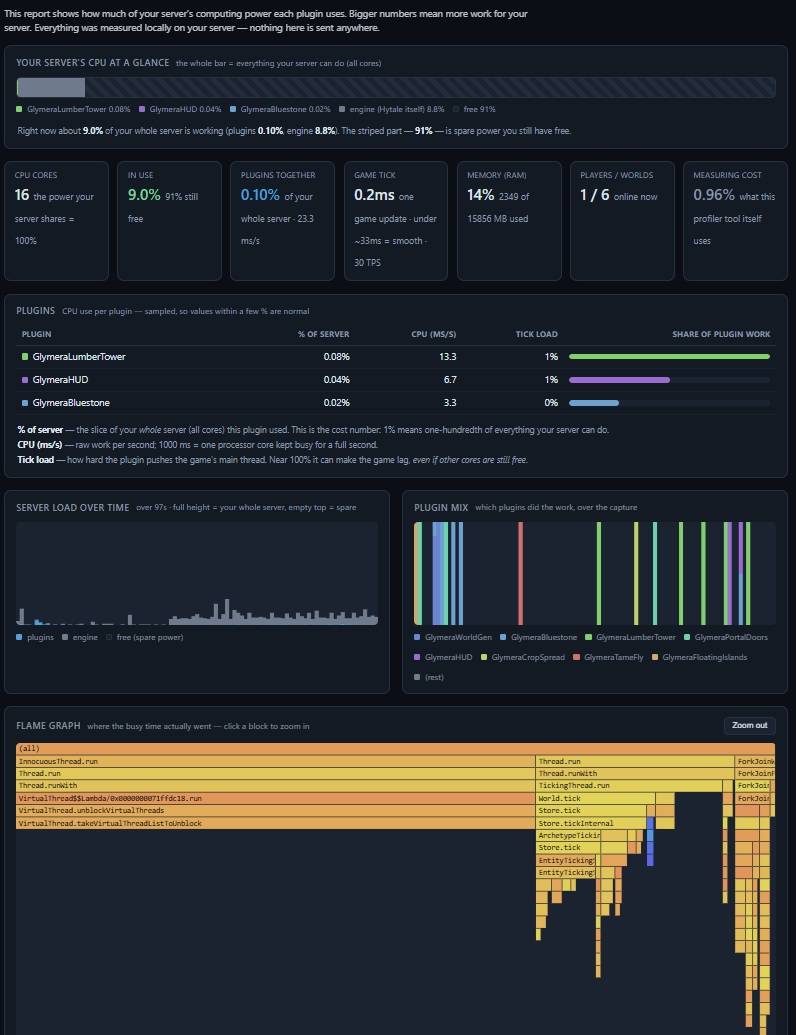
GlymeraProfiler samples your server's threads many times per second, works out which plugin (or the engine) is actually running, and turns it into a clear, per-plugin CPU breakdown. Everything — dashboard, data and flame graph — is baked into a single HTML file you open in any browser. No web server, no account, no setup.
How to use
- Drop the jar into your server's
mods/folder. - In-game as an operator, run
/glprof. It profiles for ~30 seconds and writes areport.htmlintomods/de.glymera_GlymeraProfiler/. - Download that file (hosting panel / FTP) and open it in any browser. Done — no ports, no firewall, no config.
What you get
- CPU-capacity bar — the whole bar is your server (all cores); see at a glance how much is in use and how much is spare.
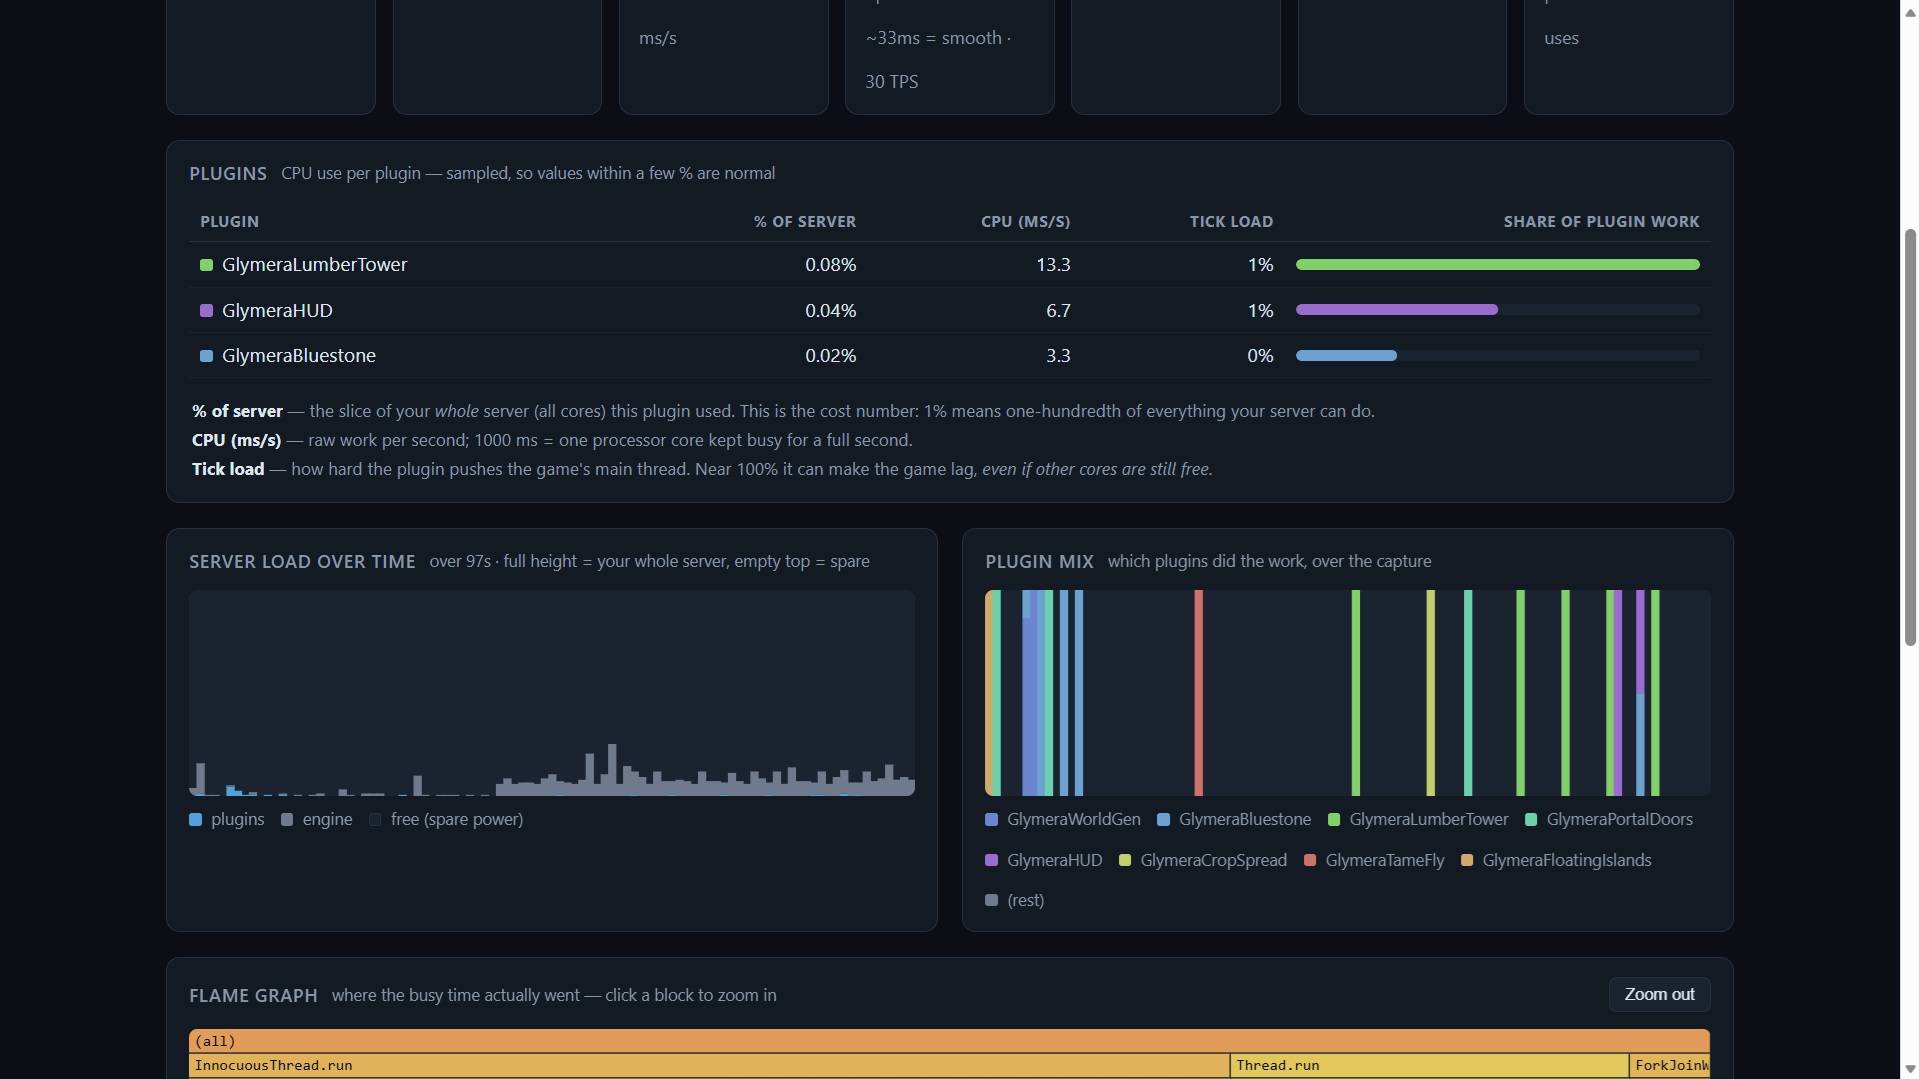
- Per-plugin table — each plugin's % of your whole server, raw CPU (ms/s), and Tick load: how hard it pushes the game's single main thread — the number that actually causes lag, even when other cores sit idle.
- Plain-English explanations on every section — written for server owners, not just developers.
- History graphs — server load (as a share of total capacity) and the plugin mix over time.
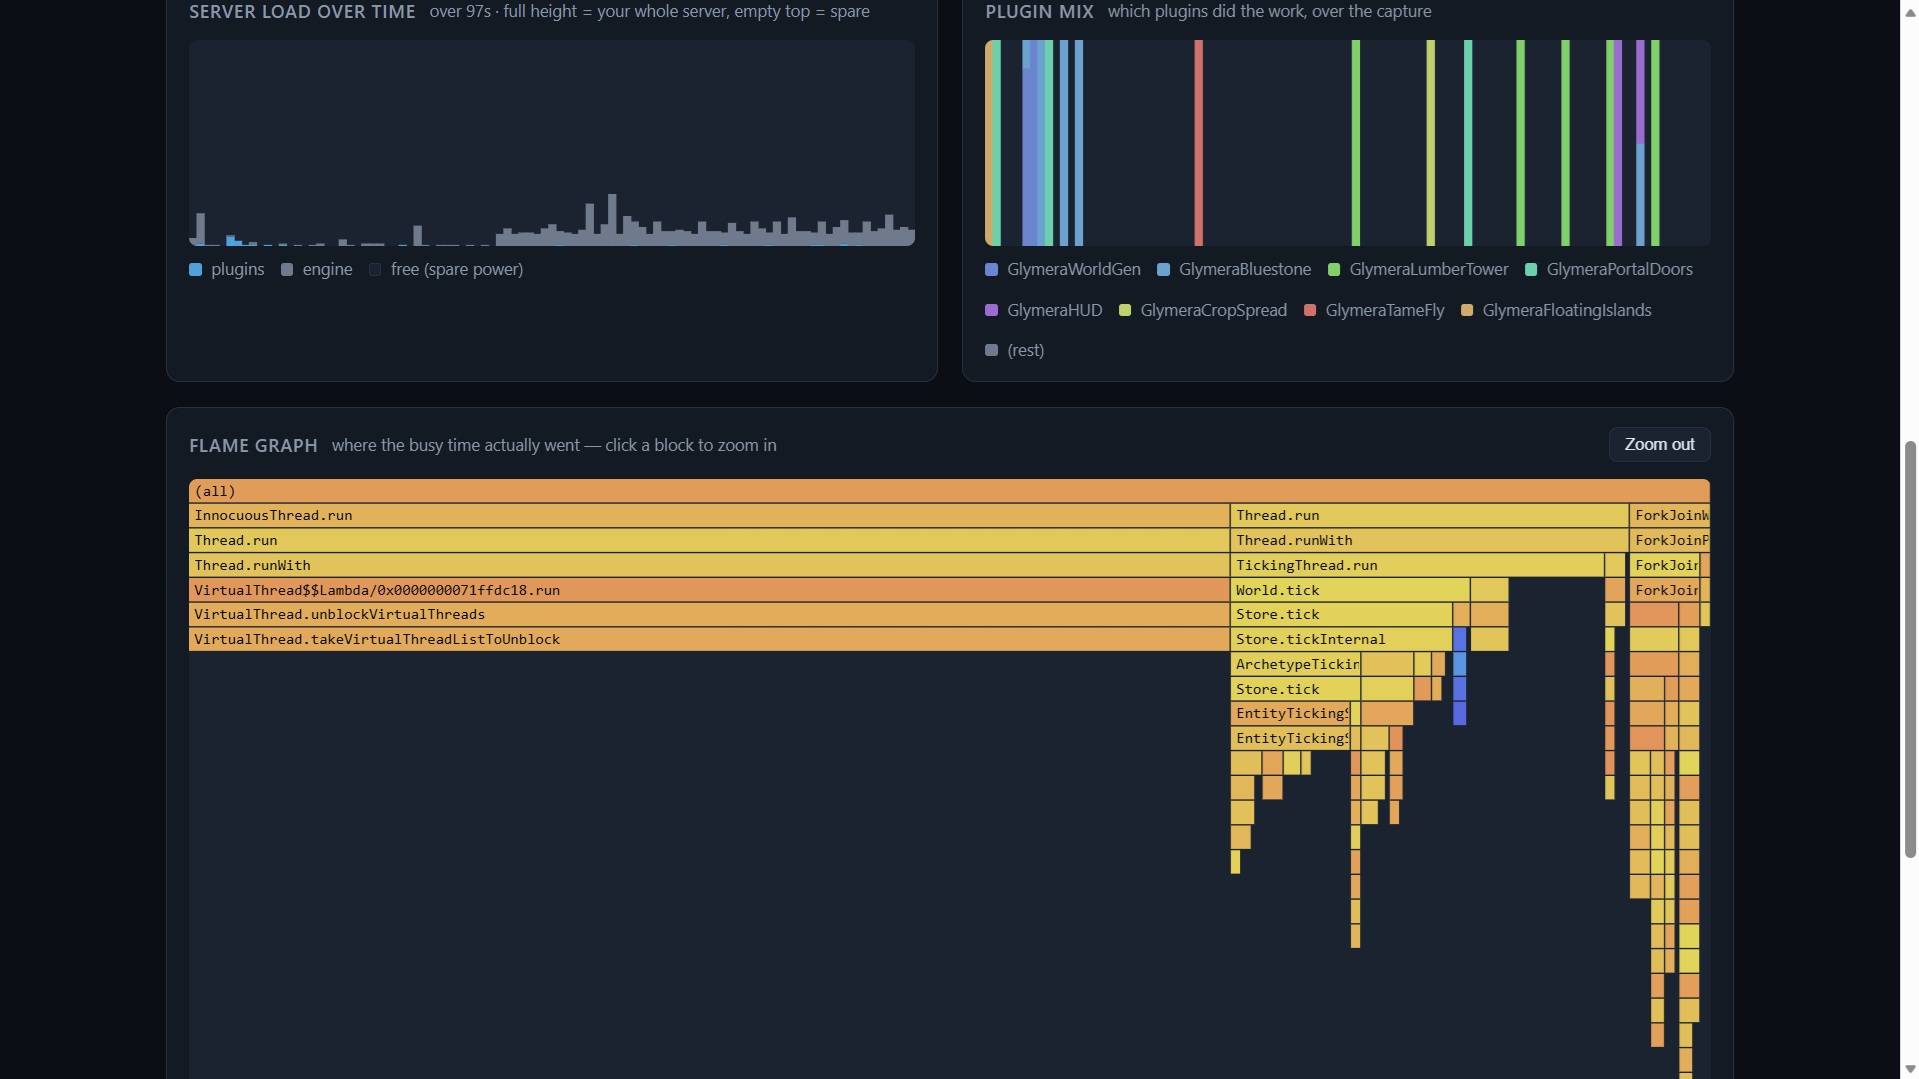
- Interactive flame graph — click in to see exactly where the busy time went.
- The profiler's own cost, shown openly (roughly 1 % of a single core).
Privacy & safety
The report is a plain local HTML file. It contains everything it needs, loads nothing from the internet, and the plugin opens no network ports — no uploads, no phone-home, nothing ever leaves your server. Safe to run on a live server: tiny footprint (about 1 % of one CPU core) and operator-only.
Configuration
mods/de.glymera_GlymeraProfiler/config.json:
reportSeconds— capture length for/glprof(default30).sampleIntervalMs— sampling period (default100= 10 Hz); lower it for finer detail.historySeconds,flameMaxNodes,flameMaxDepth,enabled.
Good to know
- It's a sampling profiler: numbers are statistical, accurate to within a few percent — perfect for spotting which plugin is heavy.
/glprofis operator-only; a normal player cannot trigger a report.
Plugin data folder: mods/de.glymera_GlymeraProfiler/
GlymeraProfiler Team