PRM - Plugin Resource Meter
- By
Always-on addon CPU & memory monitor — latency, FPS, and top usage rankings in a draggable panel.
Description
PRM — Plugin Resource Meter
Always-on addon CPU & memory monitor.
(Latency · FPS · top usage rankings · history charts)
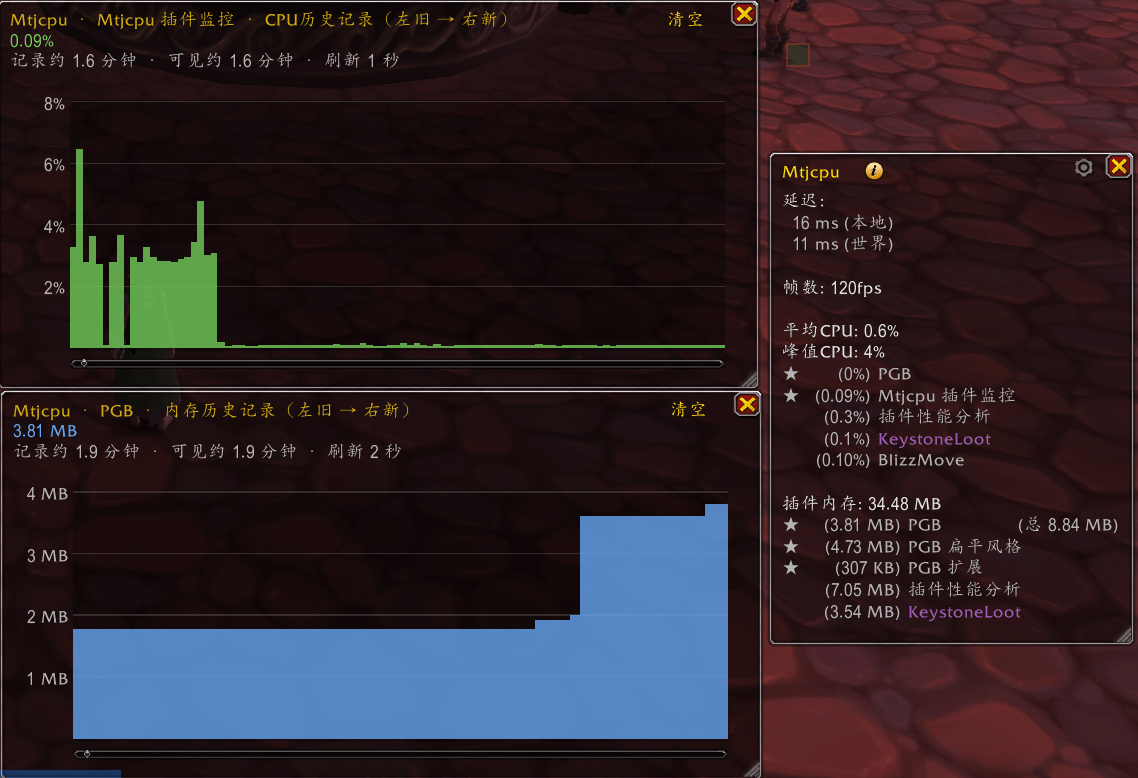
A lightweight WoW add-on that shows addon CPU and memory stats in a persistent, draggable panel — the same kind of info you get from hovering the question mark in the ESC menu, but always visible on screen.
中文简介:PRM — Plugin Resource Meter 是轻量性能监控工具,把 ESC 菜单悬停问号才能看到的统计信息,做成常驻浮动面板,随时查看,不用反复打开菜单。/prm 或小地图按钮开关监控窗。
Rename notice: Formerly Mtjcpu. Install PRM, then disable or delete the Mtjcpu folder and /reload. Old settings (MtjcpuDB) are not migrated. Leaving both enabled shows two monitors.
改名公告:原 Mtjcpu 已更名为 PRM(Plugin Resource Meter)。请安装 PRM 后禁用或删除 Mtjcpu 文件夹并重载。旧设置(MtjcpuDB)不会自动迁移。两边同时开启会出现两套监控窗。
What it shows
- Network latency (home & world)
- Current FPS
- Overall addon average & peak CPU usage
- Top addons by CPU usage (0–10, configurable)
- Total addon memory & top addons by memory
- Optional family memory total for split packs (parent + child folders)
- Per-addon CPU / memory history chart (optional recording)
Controls
- Minimap button: left-click toggles the monitor; drag to reposition
/prm— show / hide the monitor- If the minimap button is missing,
/prm minimapshows it again - Draggable panel; bottom-right handle resizes width; position & width saved
- Gear menu for settings; hover the help icon for usage tips
- Left-click a row: history chart · Right-click: pin / unpin · Shift+Left/Right: reorder pins
Refresh & notes
- CPU and memory refresh intervals are separate: 0–5 sec; 0 = off for that timer (last values kept; opening the window or changing settings still refresh once)
- Memory refresh triggers Blizzard’s full addon memory recount — prefer 3–5 sec if you want fewer spikes from this addon itself
- Numbers use the same kind of recent-average metrics as the ESC question-mark tooltip; sampling on an interval can differ slightly from a hover at the same moment
Notes
- No dependencies. Single-file add-on.
- Languages: English · 简体中文 · 繁体中文
PRM - Plugin Resource Meter Team