Lightning Profiler
- By
Find out what's making your game slow, in plain English. A profiler for frames, ticks, GPU, memory and mods.
overview.png
frames.png
sections.png
loading.png
Description
Found a bug or have an idea? Please post it on GitHub Issues instead of the comments. That's where every report gets read and tracked.

Lightning finds out what's making your game slow and tells you in plain English. A profiler for frames, ticks, graphics, memory and mods, for Minecraft 1.21.1 with NeoForge.
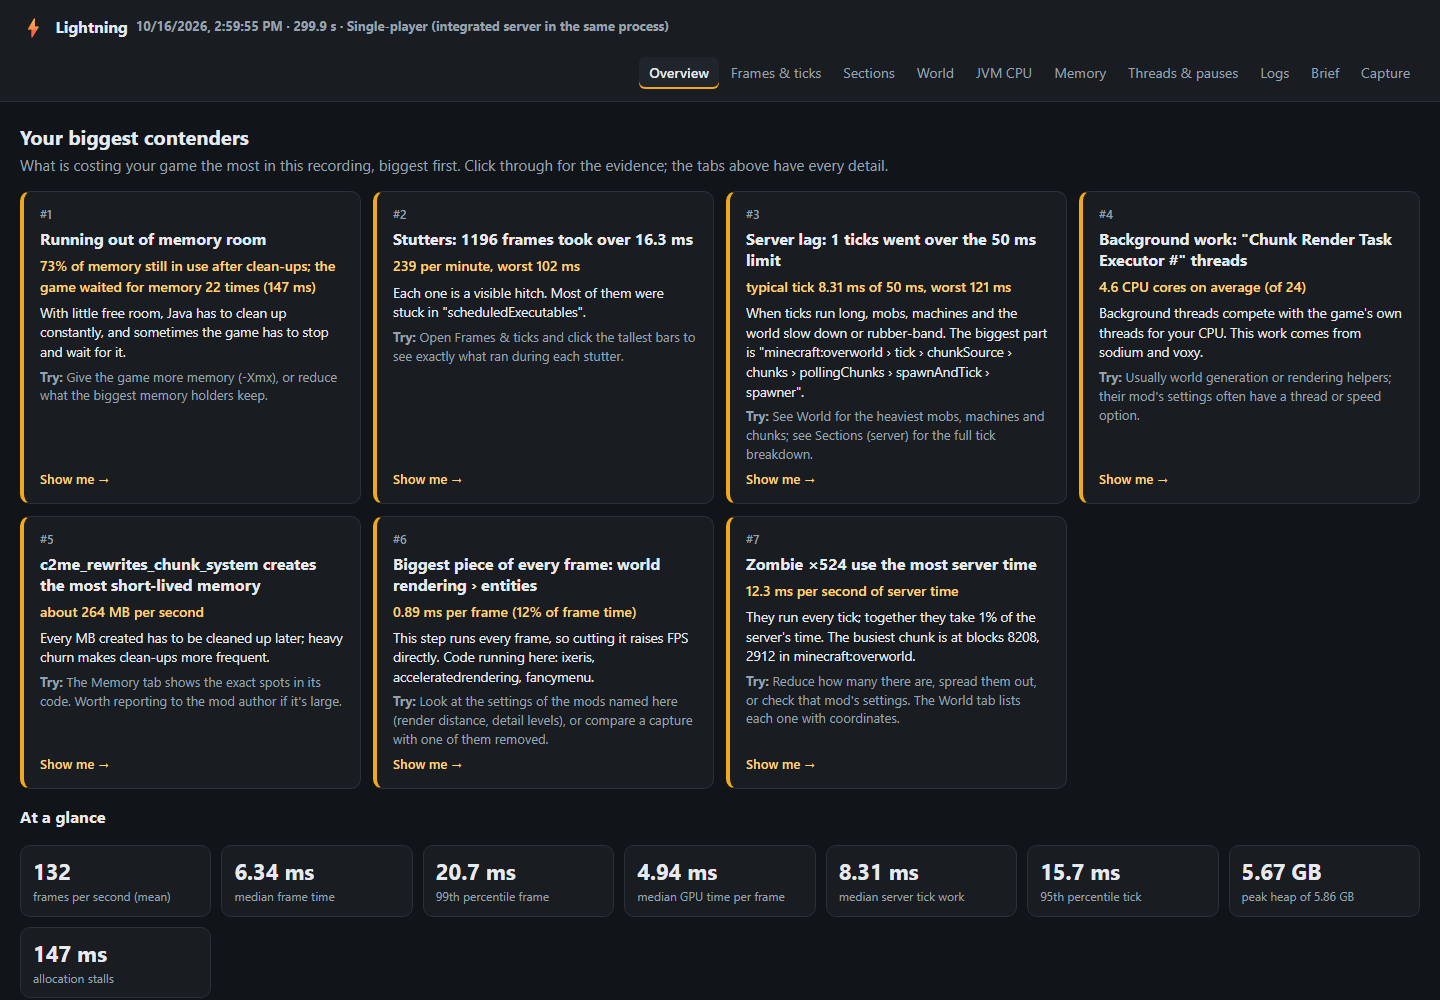
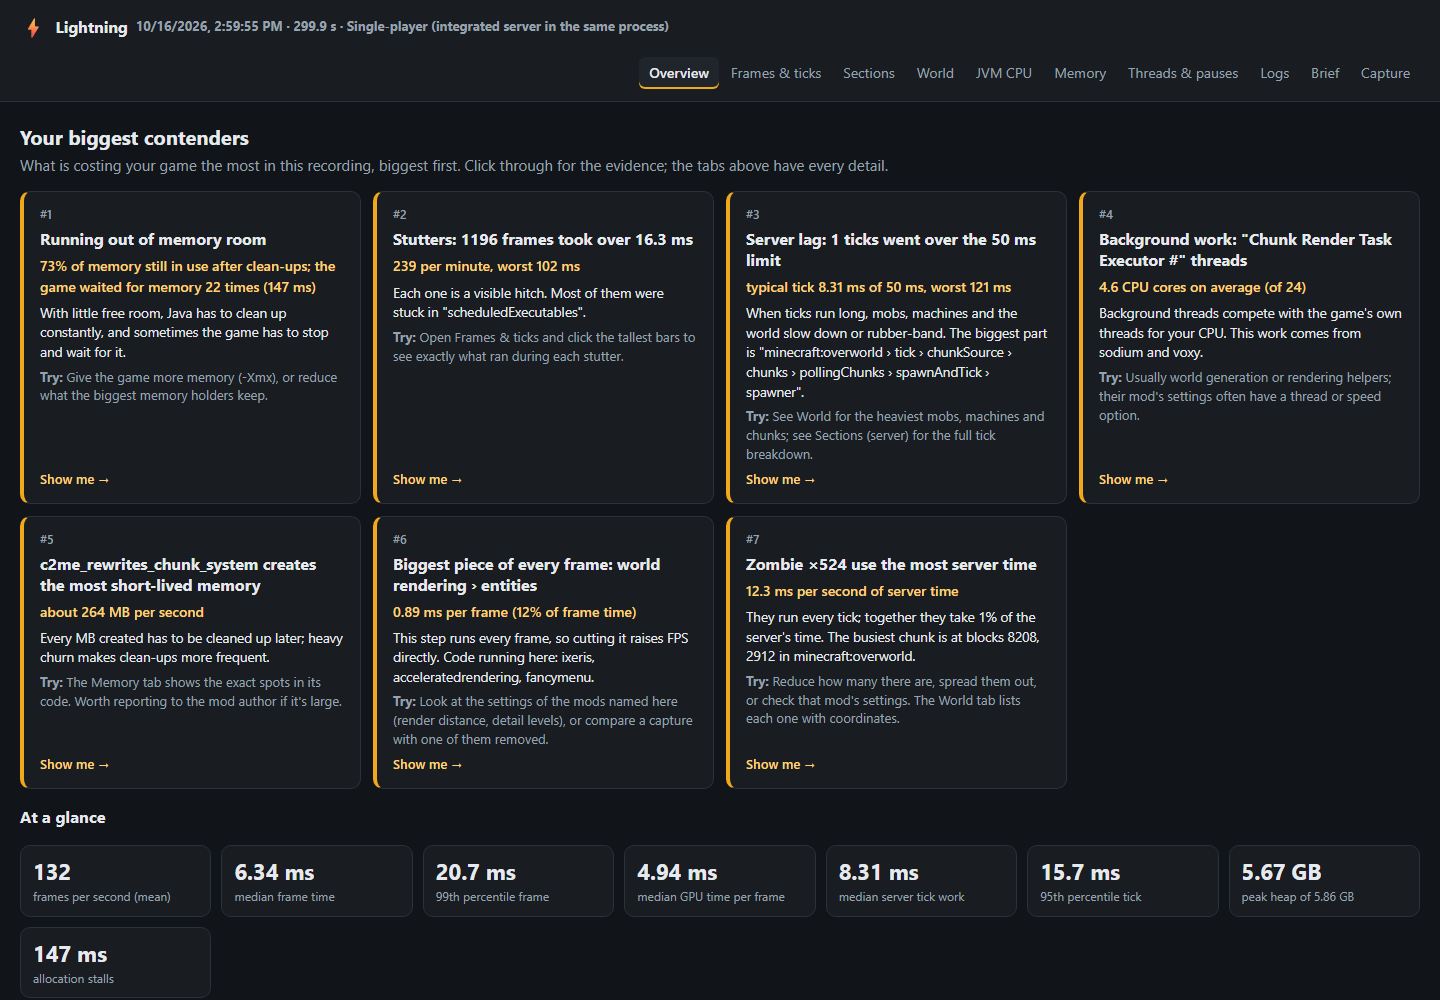
Type /lightning report, play for a minute, and a report opens in your browser. Its first page lists the biggest problems with the evidence underneath.
What it records
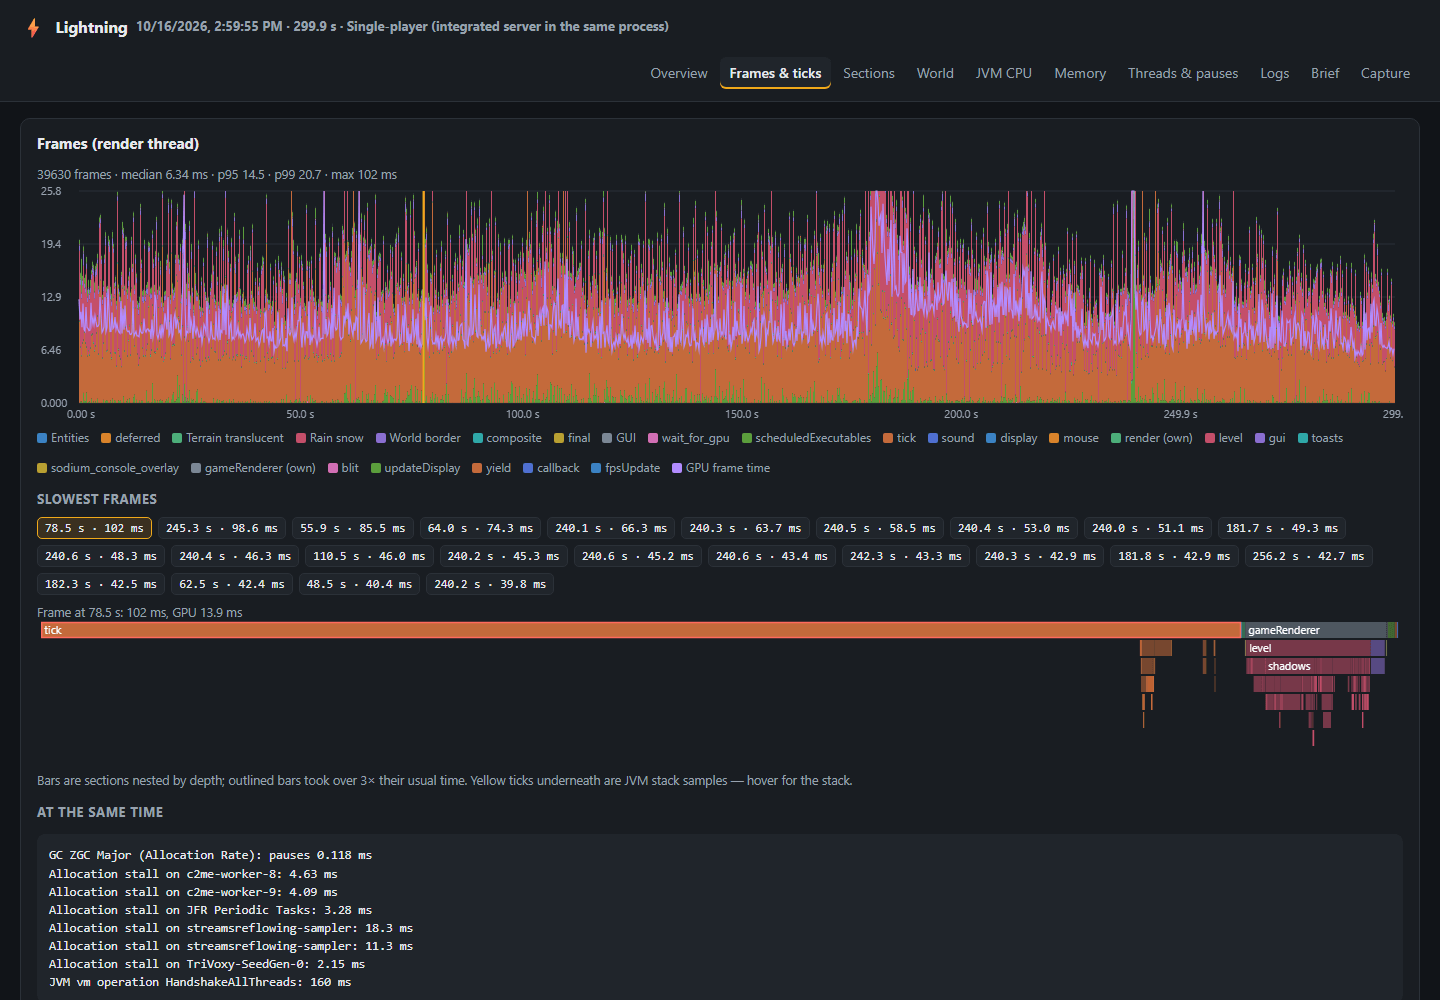
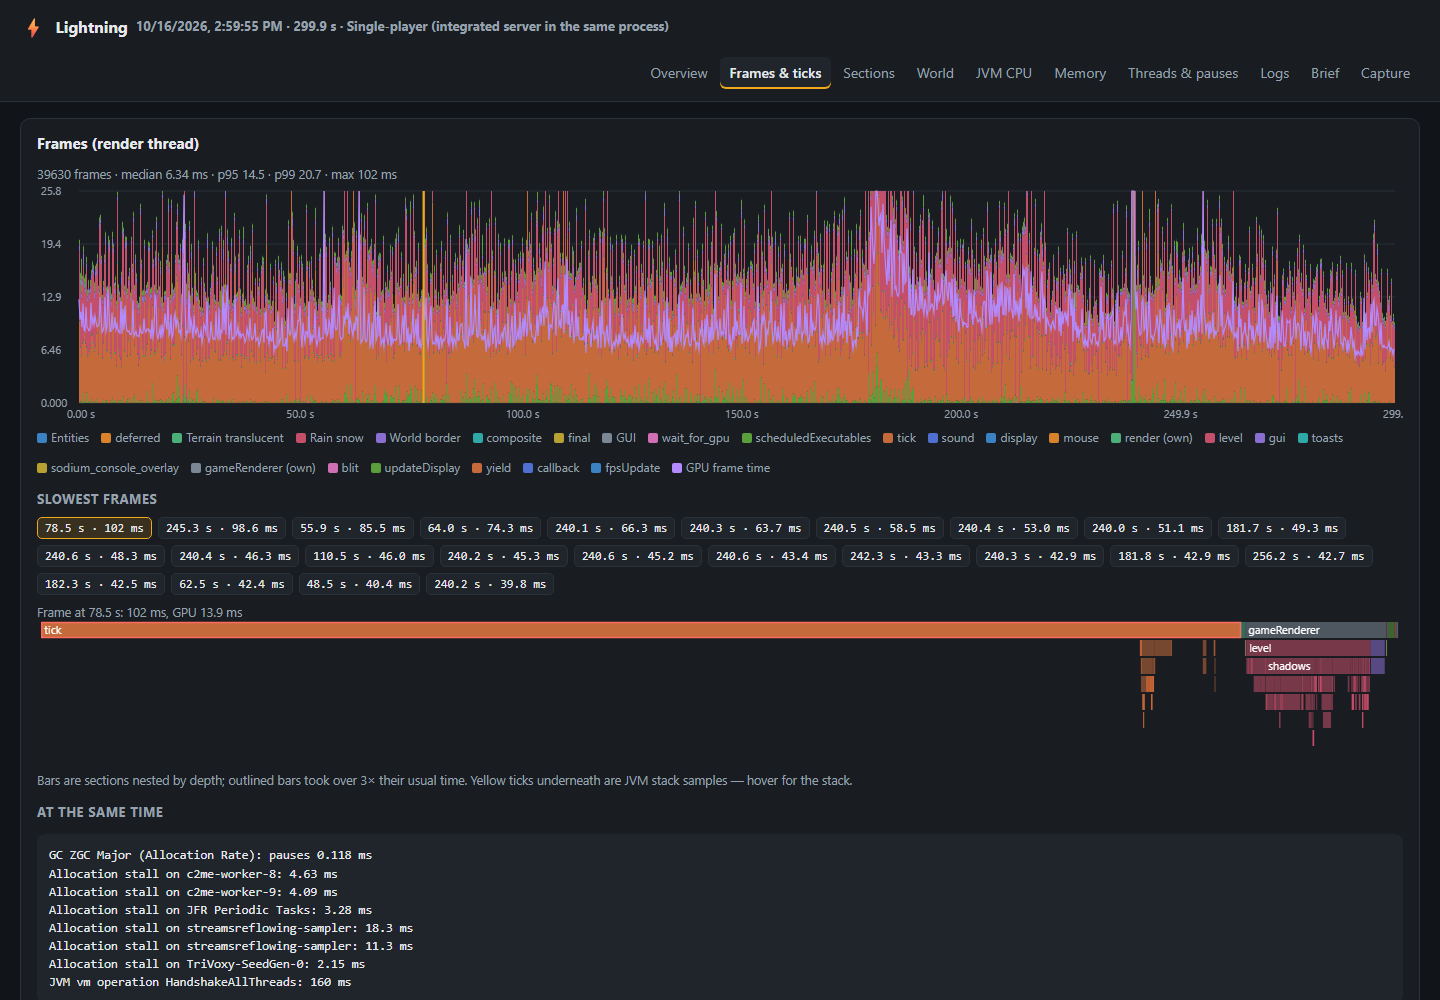
- Frames and server ticks on one timeline, with stalls, garbage-collection pauses and log lines marked where they happened.
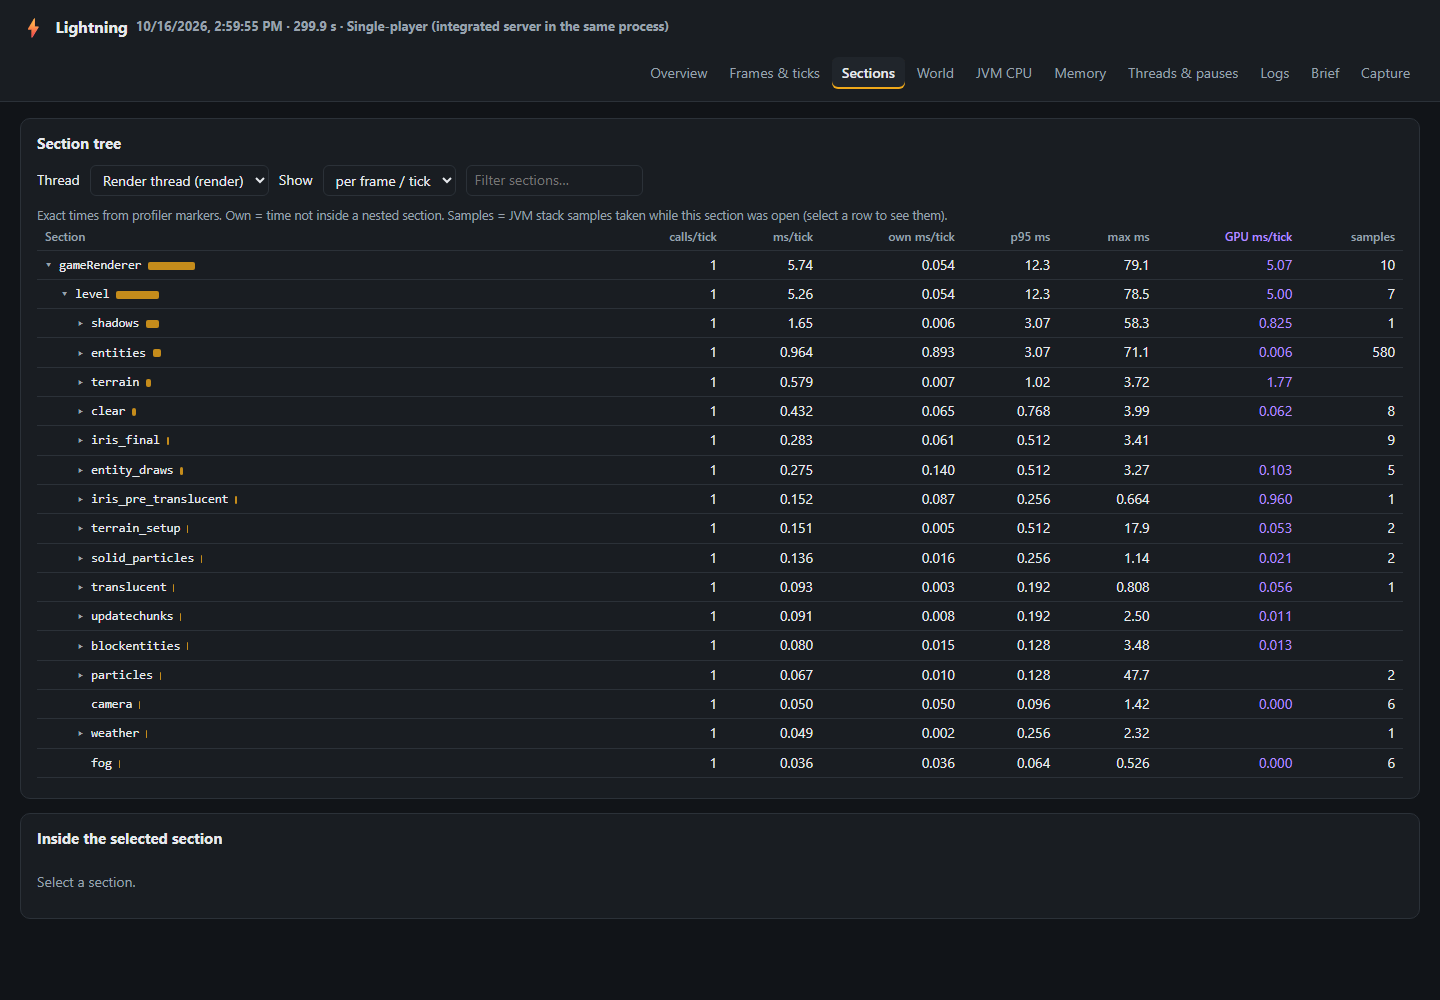
- Graphics card time per render step, including shader packs (Iris) and distant terrain.
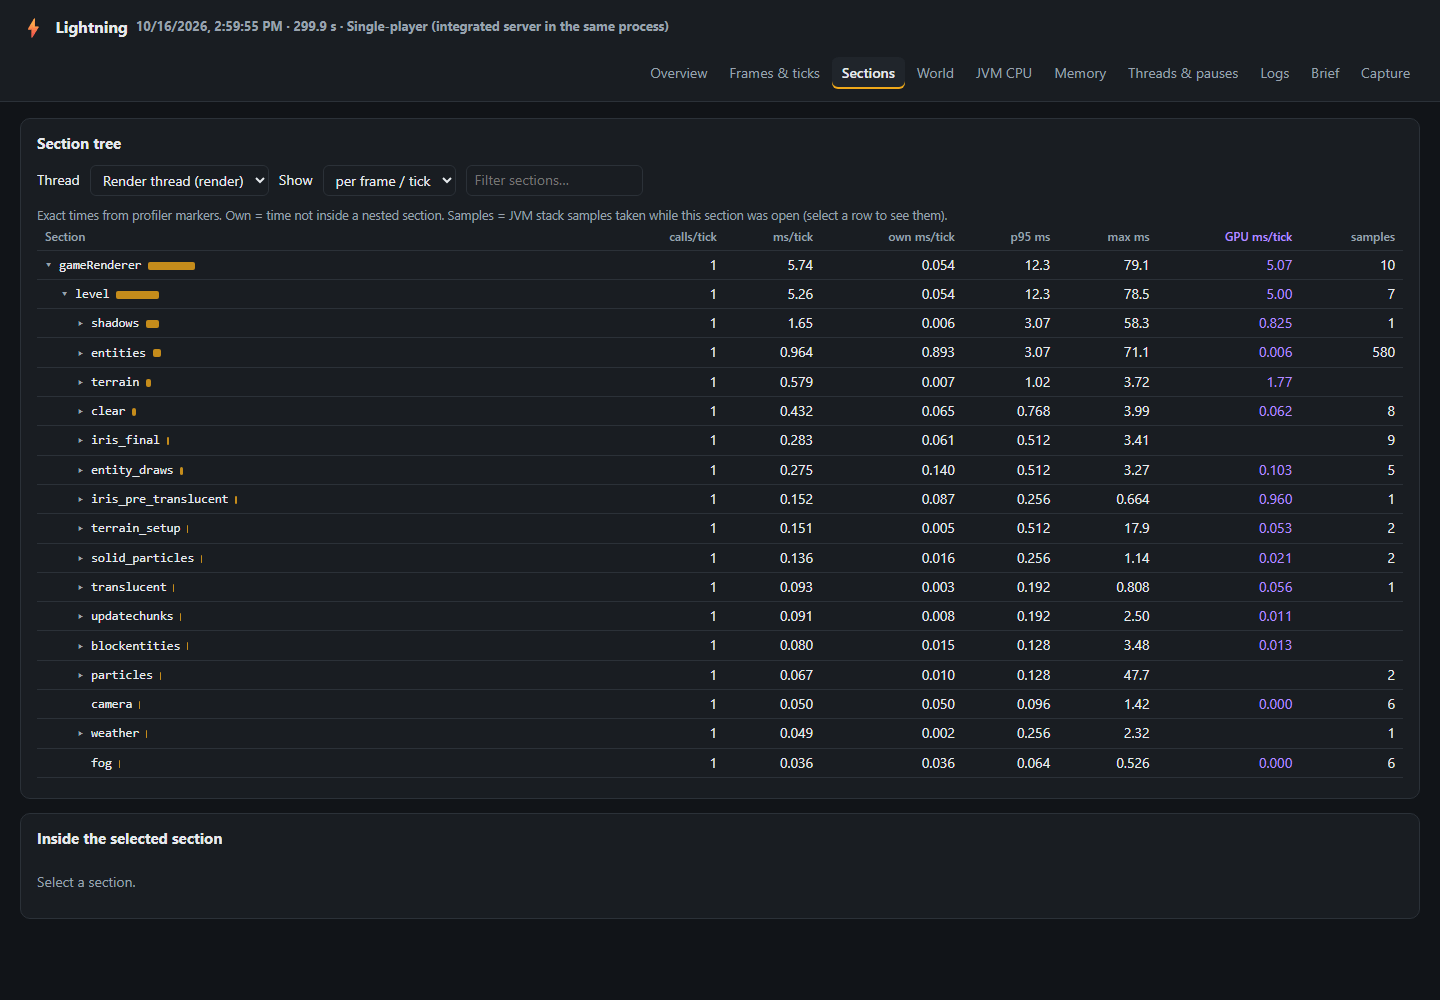
- Which mod is behind slow code, memory use and memory churn.
- Chunks, mobs and machines that cost the most server time, with a chunk map.
- Phases: mark moments like "boss fight" and compare them side by side.
Slow start-up or world joins
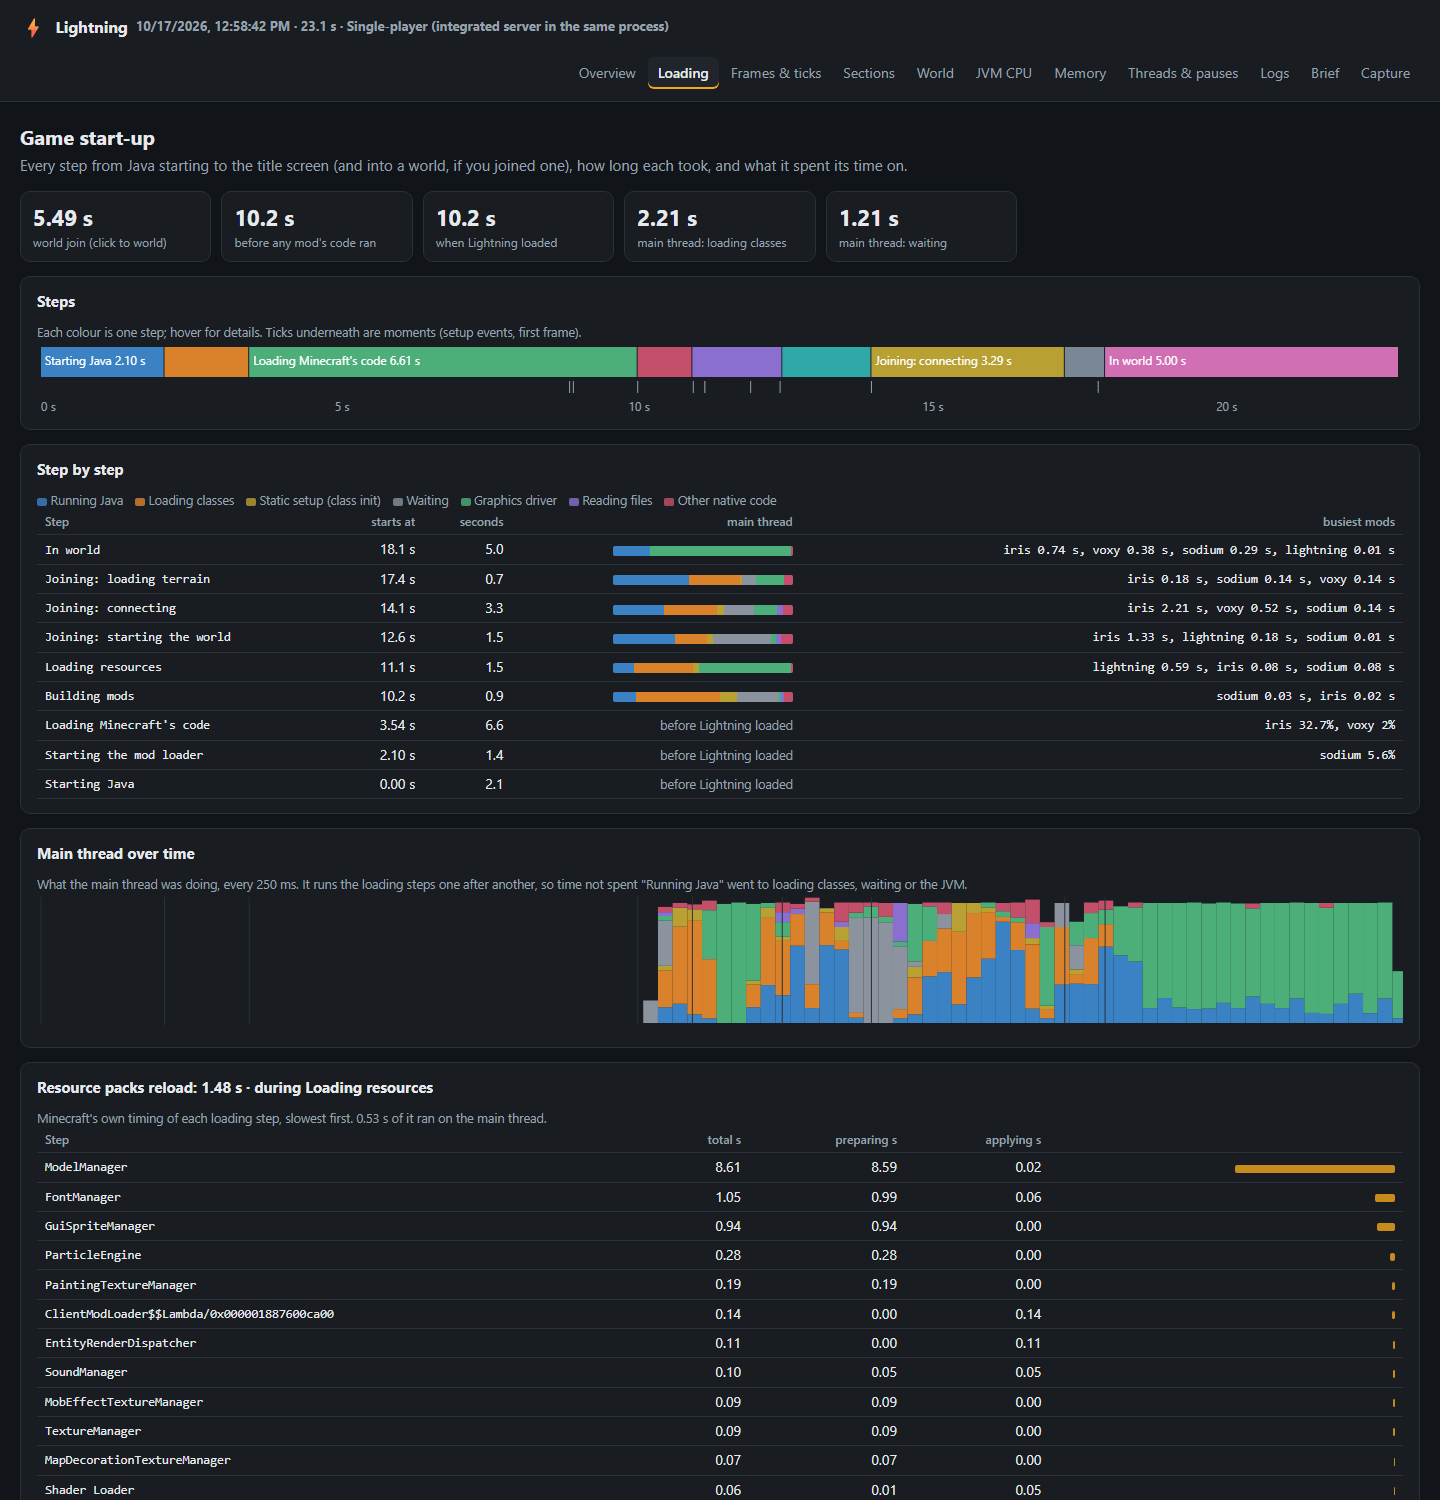
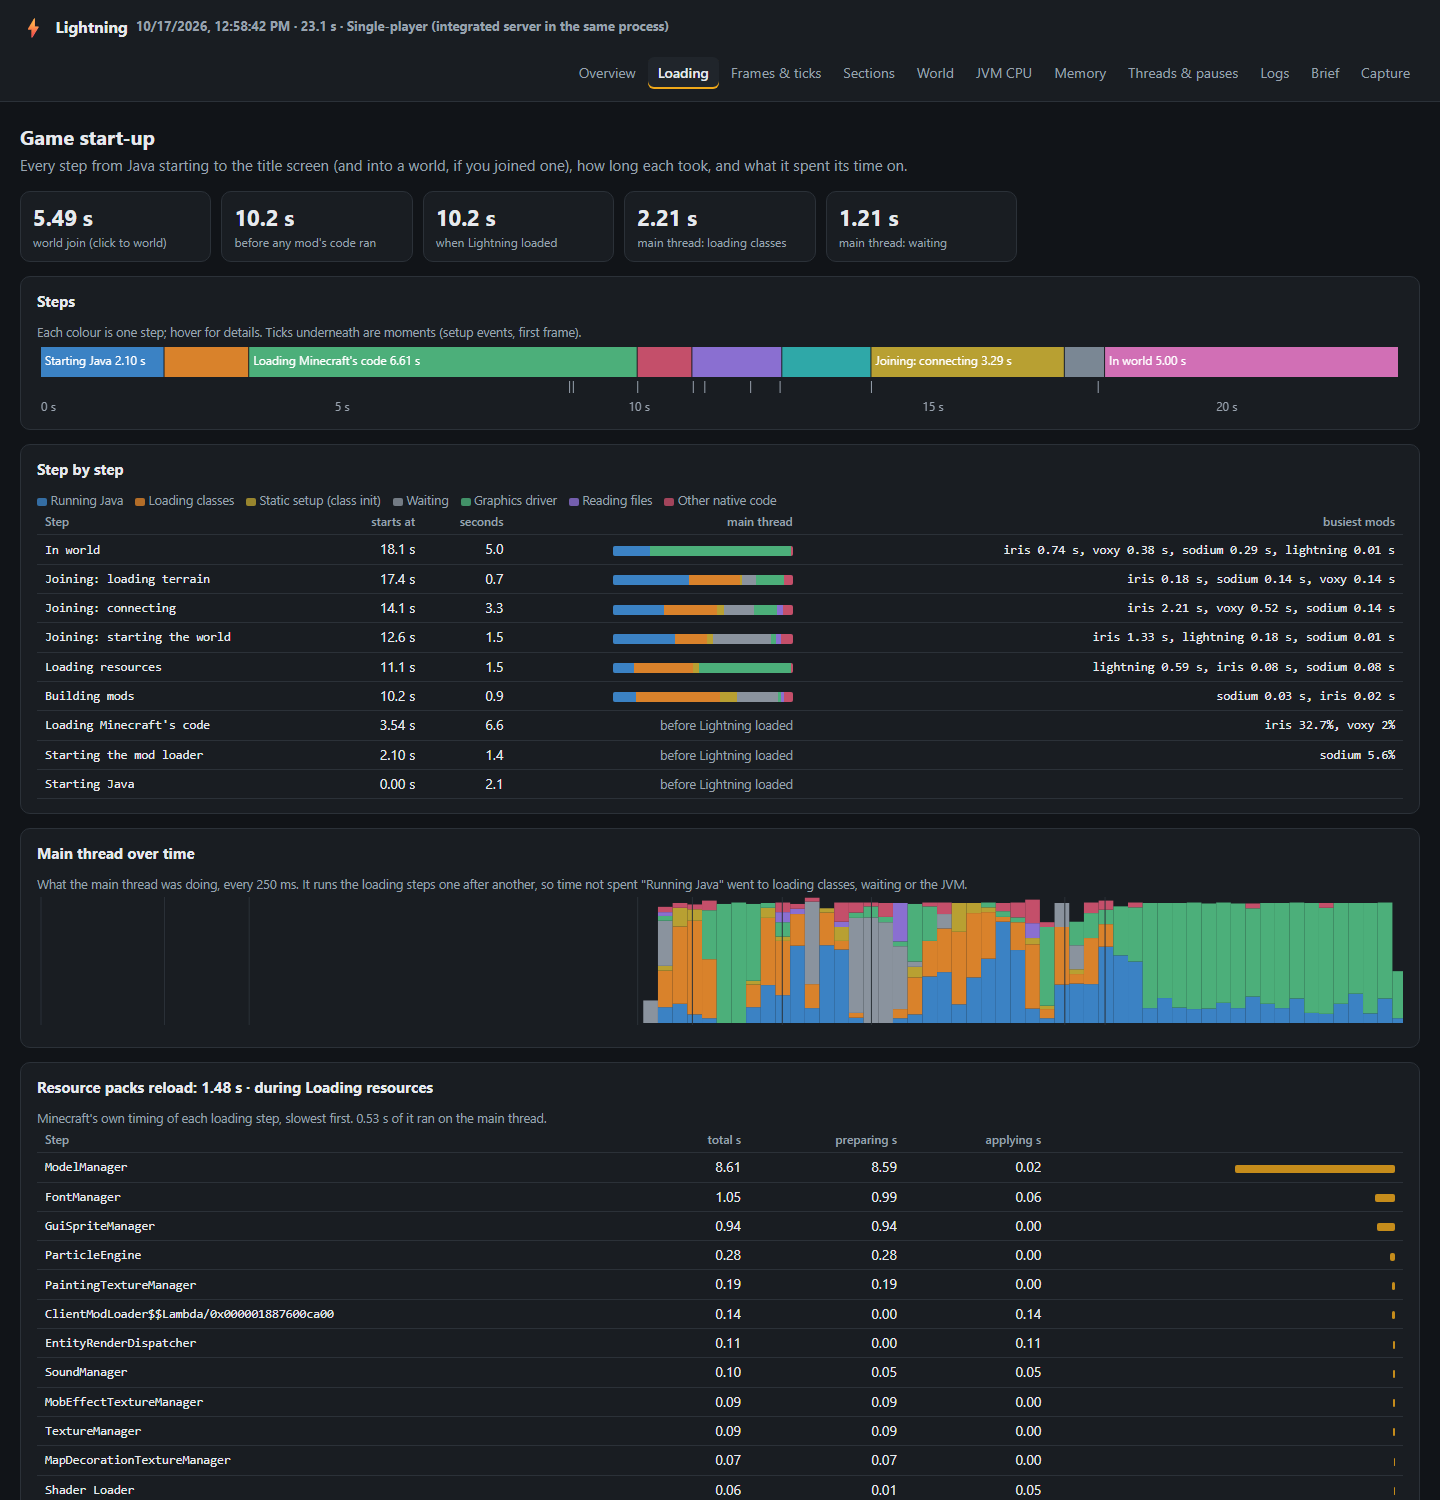
Every loading step is timed from the moment Java starts: the slowest resource loaders, which mods' mixins slow loading, and what the game sat waiting on. Add this to the game's Java arguments, launch, and open the report's Loading tab:
-Dlightning.startup=join -XX:StartFlightRecording=name=lightning,settings=profile,class-loading=trueUse title instead of join to stop at the title screen.
Commands
| Command | What it does |
|---|---|
/lightning report [seconds] |
Record for a while (default 60 s), then open the report |
/lightning profiler start / stop / cancel / status |
Manual recording |
/lightning mark <name> |
Start a named phase |
/lightning heap |
Quick look at what's filling memory |
/lightning heap deep |
Full memory breakdown by mod (freezes the game for a few seconds) |
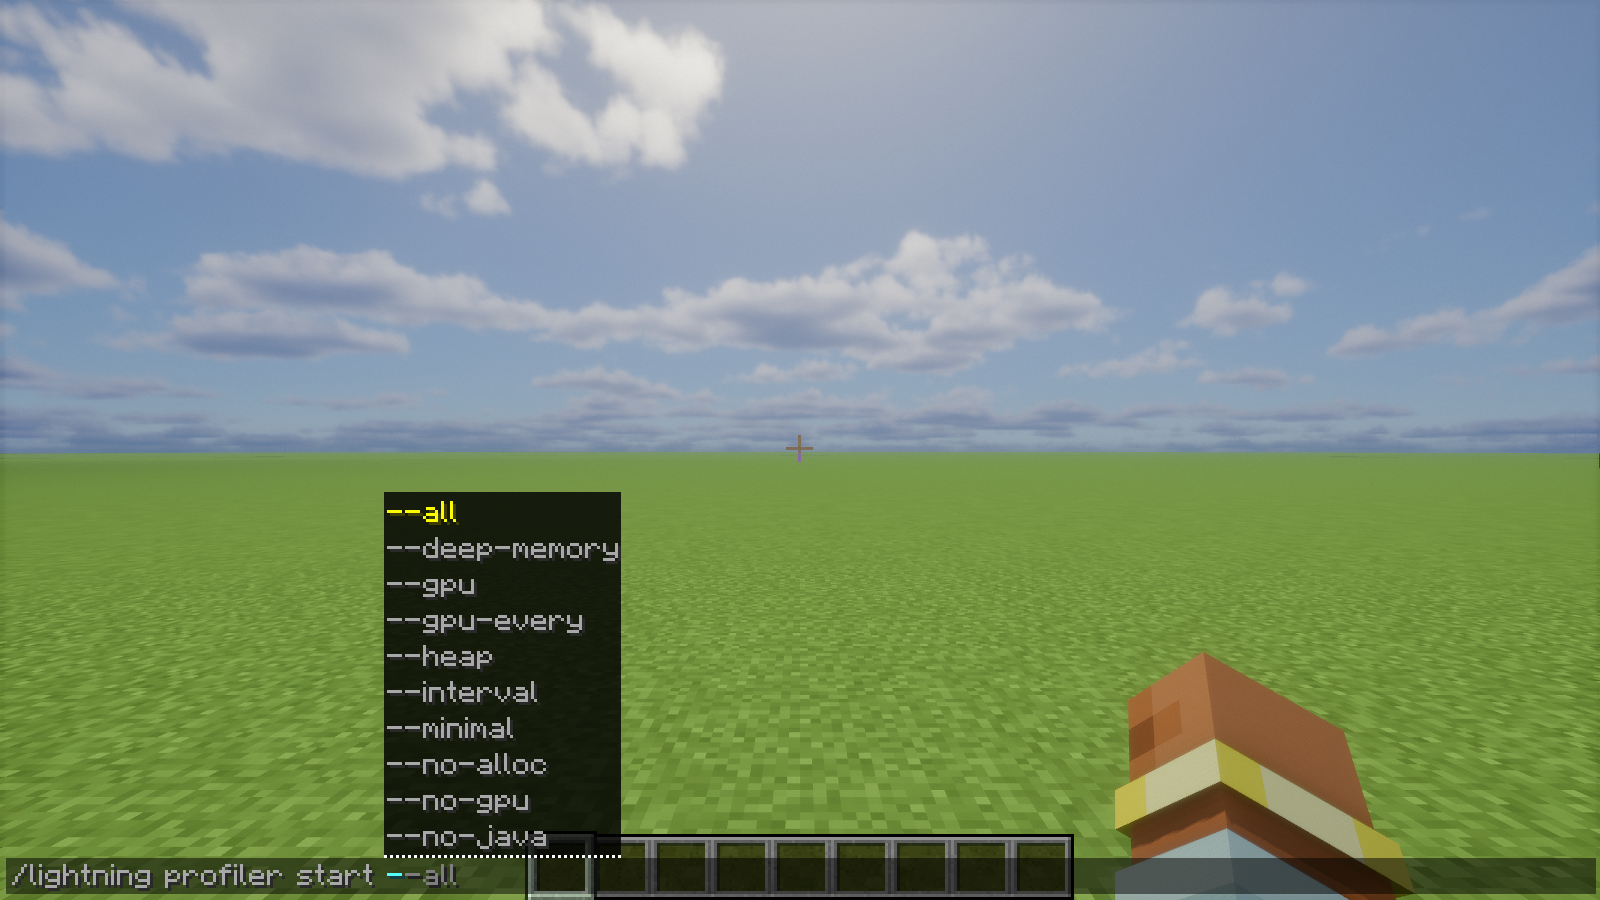
Lightning reports its own overhead, and if the game crashes mid-recording the report is rebuilt the next time you start. Each recorder can be turned on or off in Mods → Lightning → Config.
Credits
Source code on GitHub, licensed LGPL-3.0-only.
Made with AI assistance.
Lightning Profiler Team