

⚙ TPS MonitorV3- Dev Enterprise Edition
- By
From: Basic TPS monitor (Main menu, action bar, per‑player settings, tick history) To: Full developer suite with 10+ diagnostic tools, memory leak detection, AI advice, and command profiling, and Much much more
TPS SCREEN.png
TPS SCREEN2.png
TPS SCREEN3.PNG
TPS SCREEN4.png
Description
(Not in association with TPS MONITOR Plugin on Modrinth)
🆕 New In V3
🆕 TPS Monitor item — hand-gated activation The display, alerts, and menus are now only active while the TPS Monitor item is held in the main hand.
🆕 Auto-deactivation on item removal Switching slots, dropping the item, or removing it from inventory immediately clears the action bar and disables all per-player tracking.(including player ping)
==========================================================================================
✨ What’s New in 2.2
Verbose Mode Toggle – When enabled, the action bar shows:
TPS (colored)
Ping (average latency in ms)
Entities (nearby entity count)
Load (estimated player load %)
Overrides the normal display mode (Full, Compact, Graph, Player, Off) while active.
Persistent – setting saves to world dynamic properties and survives server restarts.
Toggle via:
Main Menu → 🛠 Dev Tools → 🔊 Verbose Mode (toggle)
Command: /scriptevent tps:verbosetoggle
🎮 How to Use
Open Main Menu (hold sneak for 1.5 sec).
Select 🛠 Dev Tools.
Choose 🔊 Verbose Mode (toggle) – you’ll see a confirmation in chat.
Your action bar immediately changes to the detailed view.
Toggle again to return to your normal display mode.
⚙️ Technical Notes
Works alongside all existing display modes – when verbose is off, your chosen mode (Full, Compact, etc.) is used.
No performance impact when disabled.
Requires Ping Monitor to be enabled for ping data (otherwise shows 0ms).
==========================================================================
Player Ping Monitor – Tracks average ping (latency) for every player on the server.
Toggle On/Off – Ping tests are disabled by default to save performance. Enable only when needed.
New Dev Tools Buttons:
🌐 Player Ping – Displays current ping report for all online players.
📡 Ping Monitor (toggle) – Turns the ping tracker on or off.
Scriptevent Commands:
/scriptevent tps:ping – Show ping report.
/scriptevent tps:pingtoggle – Enable/disable monitoring.
🎮 How to Use
Open Main Menu (hold sneak for 1.5 seconds).
Select 🛠 Dev Tools.
Choose 📡 Ping Monitor (toggle) – enable it (you’ll see a confirmation in chat).
Wait a few seconds for data to collect.
Select 🌐 Player Ping to see the results.
⚙️ Technical Notes
Ping is estimated every 20 ticks (~1 second) using a silent title command – no chat spam.
When disabled, no performance cost.
Ping data is not saved between sessions (resets on server restart).
Works on all platforms (Windows, console, mobile, dedicated server)
=======================================================================
📡 Webhook Reporter – Complete Setup Guide
The Webhook Reporter automatically captures lag spikes and performance alerts, saves them to a queue, and lets an external bridge addon forward them to Discord. This guide walks you through the entire process – from getting a Discord webhook URL to connecting a bridge addon.
🎯 What You’ll Achieve
Discord receives a message every time your server lags (e.g., Lag spike: 95ms (+45ms) at 123 64 -456 (overworld)).
You can also send test messages to verify everything works.
No extra commands needed – the monitor queues alerts automatically.
📝 Step 1: Get a Discord Webhook URL
Open your Discord server.
Go to Server Settings → Integrations → Webhooks.
Click New Webhook.
Name it (e.g., TPS Monitor), choose a channel, and click Copy Webhook URL.
Keep this URL – you’ll paste it into the game.
Example URL:
https://discord.com/api/webhooks/1234567890/abcdefg
🎮 Step 2: Set the Webhook URL in Minecraft
Join your world (operator permissions required).
Open the Main Menu – hold sneak (Left Stick / Shift) for 1.5 seconds.
Select 🛠 Dev Tools.
Choose 📡 Set Webhook URL.
Paste your Discord webhook URL into the text field and submit.
✅ You’ll see: Webhook URL set to: https://discord.com/api/webhooks/...
📋 Step 3: Understand How the Queue Works
Your TPS Monitor does not send messages directly to Discord (Bedrock can’t make HTTP requests). Instead, it saves every alert into a queue stored in the world’s data.
Queue Location
Dynamic property: tps:webhookQueue
Format: timestamp|message (one entry per line, JSON array internally)
Example Queue Entries (as stored)
1734567890123|Lag spike: 95ms (+45ms) at 123 64 -456 (overworld)
1734567895123|Lag spike: 112ms (+62ms) at 200 70 300 (nether)
1734567900123|Test message from TPS Monitor
View the Queue In‑Game
Main Menu → 🛠 Dev Tools → 📋 Webhook Queue (shows last 10 messages).
Or use: /scriptevent tps:webhookqueue
🔌 Step 4: Connect an External Bridge Addon
You need a bridge addon that reads tps:webhookQueue and sends the messages to Discord. Here are three easy options:
Option A: StarBridge (Recommended for Simplicity)
Download StarBridge from MCPEDL or CurseForge.
Install it in your behaviour pack folder.
It automatically reads tps:webhookQueue and sends every entry to the Discord webhook you set in the TPS Monitor.
No extra configuration – just install and enable.
Works on Realms and dedicated servers.
Option B: BedrockBridge (Full Bot)
Invite BedrockBridge bot to your Discord server.
Install the bridge addon on your Bedrock Dedicated Server (BDS).
The bot listens to the queue and posts alerts to your chosen channel.
Supports custom formatting.
Option C: Custom Script (For Developers)
If you want to write your own bridge, use the WebhookAPI library. Example:
javascript
import { WebhookClient } from "webhookapi";
import * as mc from "@minecraft/server";
const webhook = new WebhookClient({ url: "YOUR_DISCORD_WEBHOOK_URL" });
const queue = mc.world.getDynamicProperty("tps:webhookQueue") || "[]";
const entries = JSON.parse(queue);
for (const entry of entries) {
const [timestamp, message] = entry.split("|");
webhook.send(message);
}
mc.world.setDynamicProperty("tps:webhookQueue", "[]");
🧪 Step 5: Test Everything
In Minecraft, open Dev Tools → 🔔 Test Webhook.
You’ll see: Test webhook message queued.
Check the queue via 📋 Webhook Queue – the test message appears.
If your bridge addon is active, you should see the message in Discord within a few seconds.
💡 Pro Tip: Trigger a real lag spike by running a command like /summon zombie 100 (if your server can handle it). Then watch Discord for the alert.
❓ Troubleshooting
Problem Solution
“No webhook URL set” Go to Dev Tools → Set Webhook URL and paste a valid Discord webhook.
Queue shows messages but Discord gets nothing Your bridge addon isn’t running or isn’t configured correctly. Re‑install StarBridge or check your bot.
Messages appear multiple times The bridge may not be clearing the queue. Make sure the bridge deletes or marks entries as sent.
I want to clear the queue manually Use /scriptevent tps:webhookqueue to view, then manually delete the dynamic property (or restart the world).
📦 Summary of Scriptevents for Webhook
Command Action
/scriptevent tps:setwebhook <url> Set Discord webhook URL (same as Dev Tools button).
/scriptevent tps:webhookqueue Show last 10 queued messages.
/scriptevent tps:testwebhook Queue a test message.
✅ Final Checklist
Discord webhook URL created.
URL pasted into Minecraft (Dev Tools → Set Webhook URL).
External bridge addon installed (e.g., StarBridge).
Test message appears in Discord.
Real lag spike triggers an alert in Discord.
====================================================================================
📦 TPS Engine Monitor – Developer Edition
The ultimate server performance & debugging tool for Minecraft Bedrock Edition.
Monitor live TPS, tick times, jitter, dropped ticks – plus over 10 professional developer tools to profile commands, detect memory leaks, find lag hotspots, and optimise your addons.
🎮 What Does It Do?
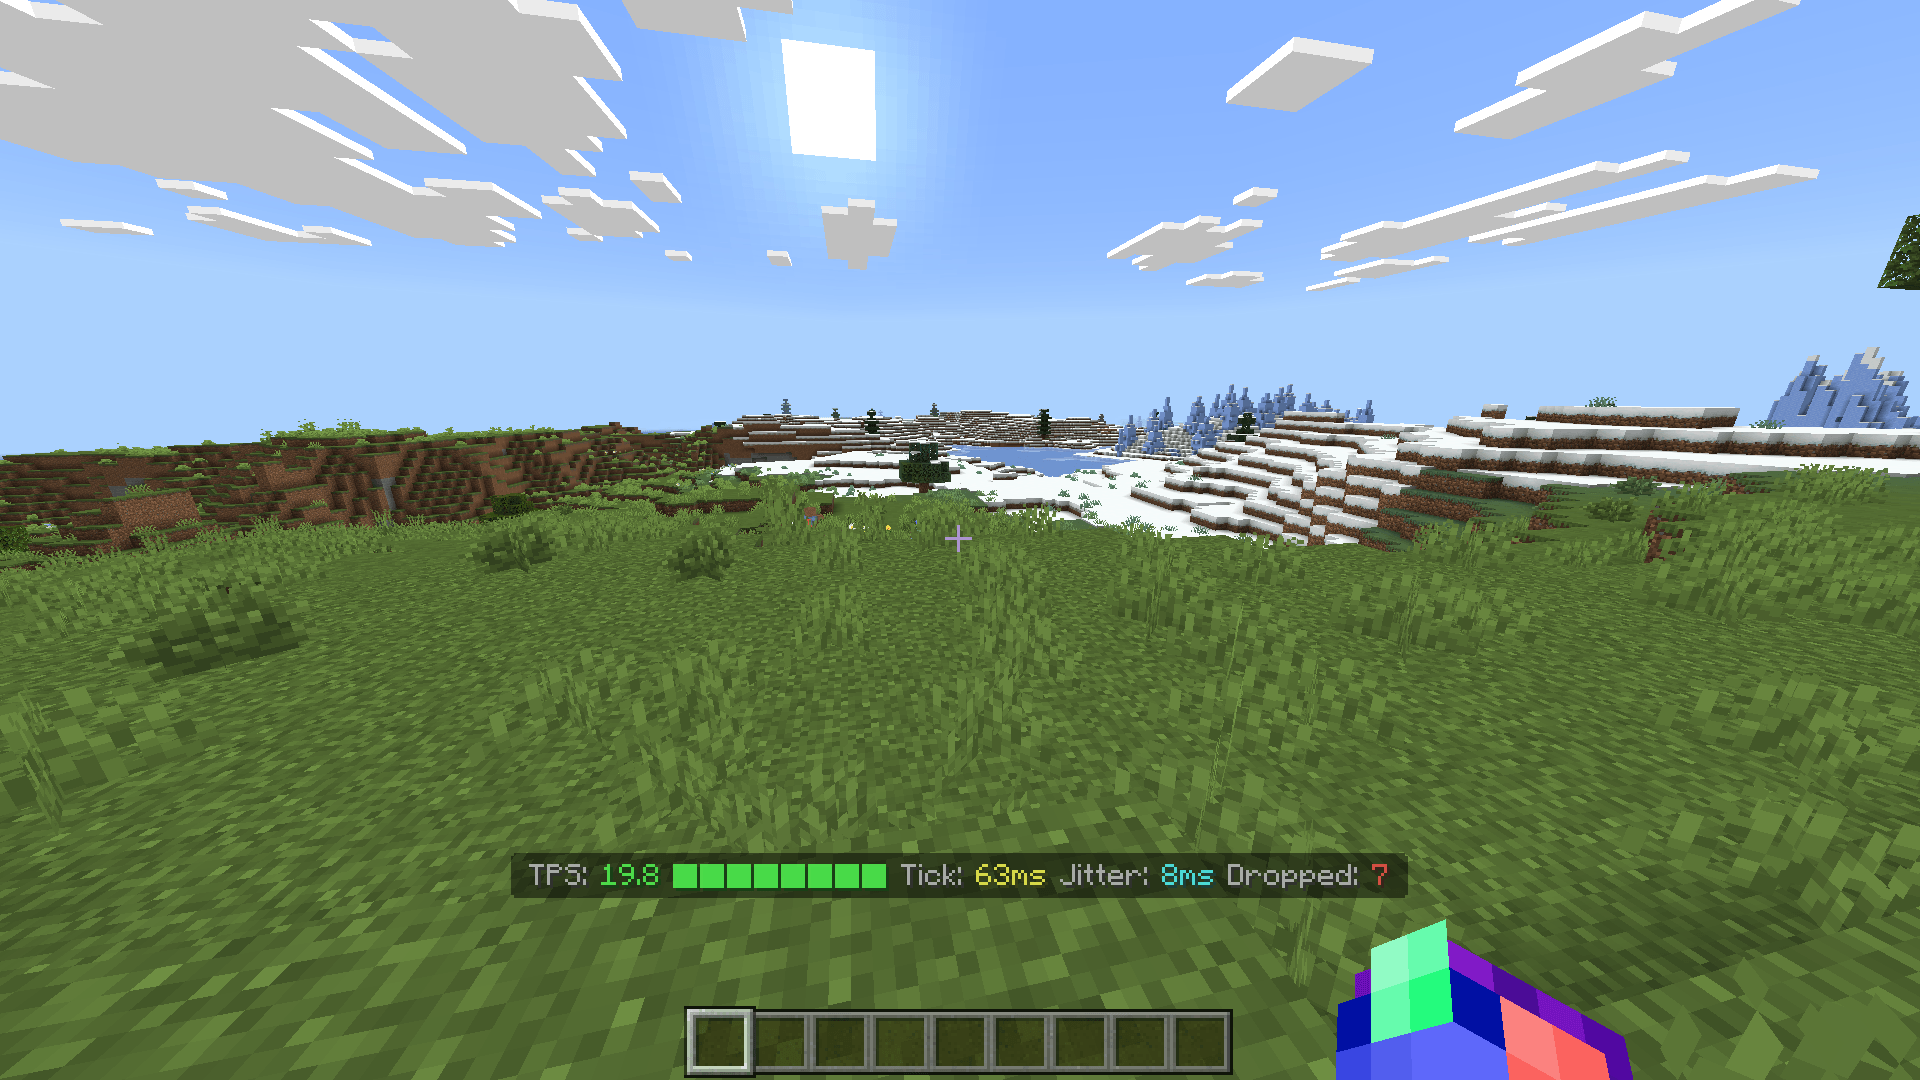
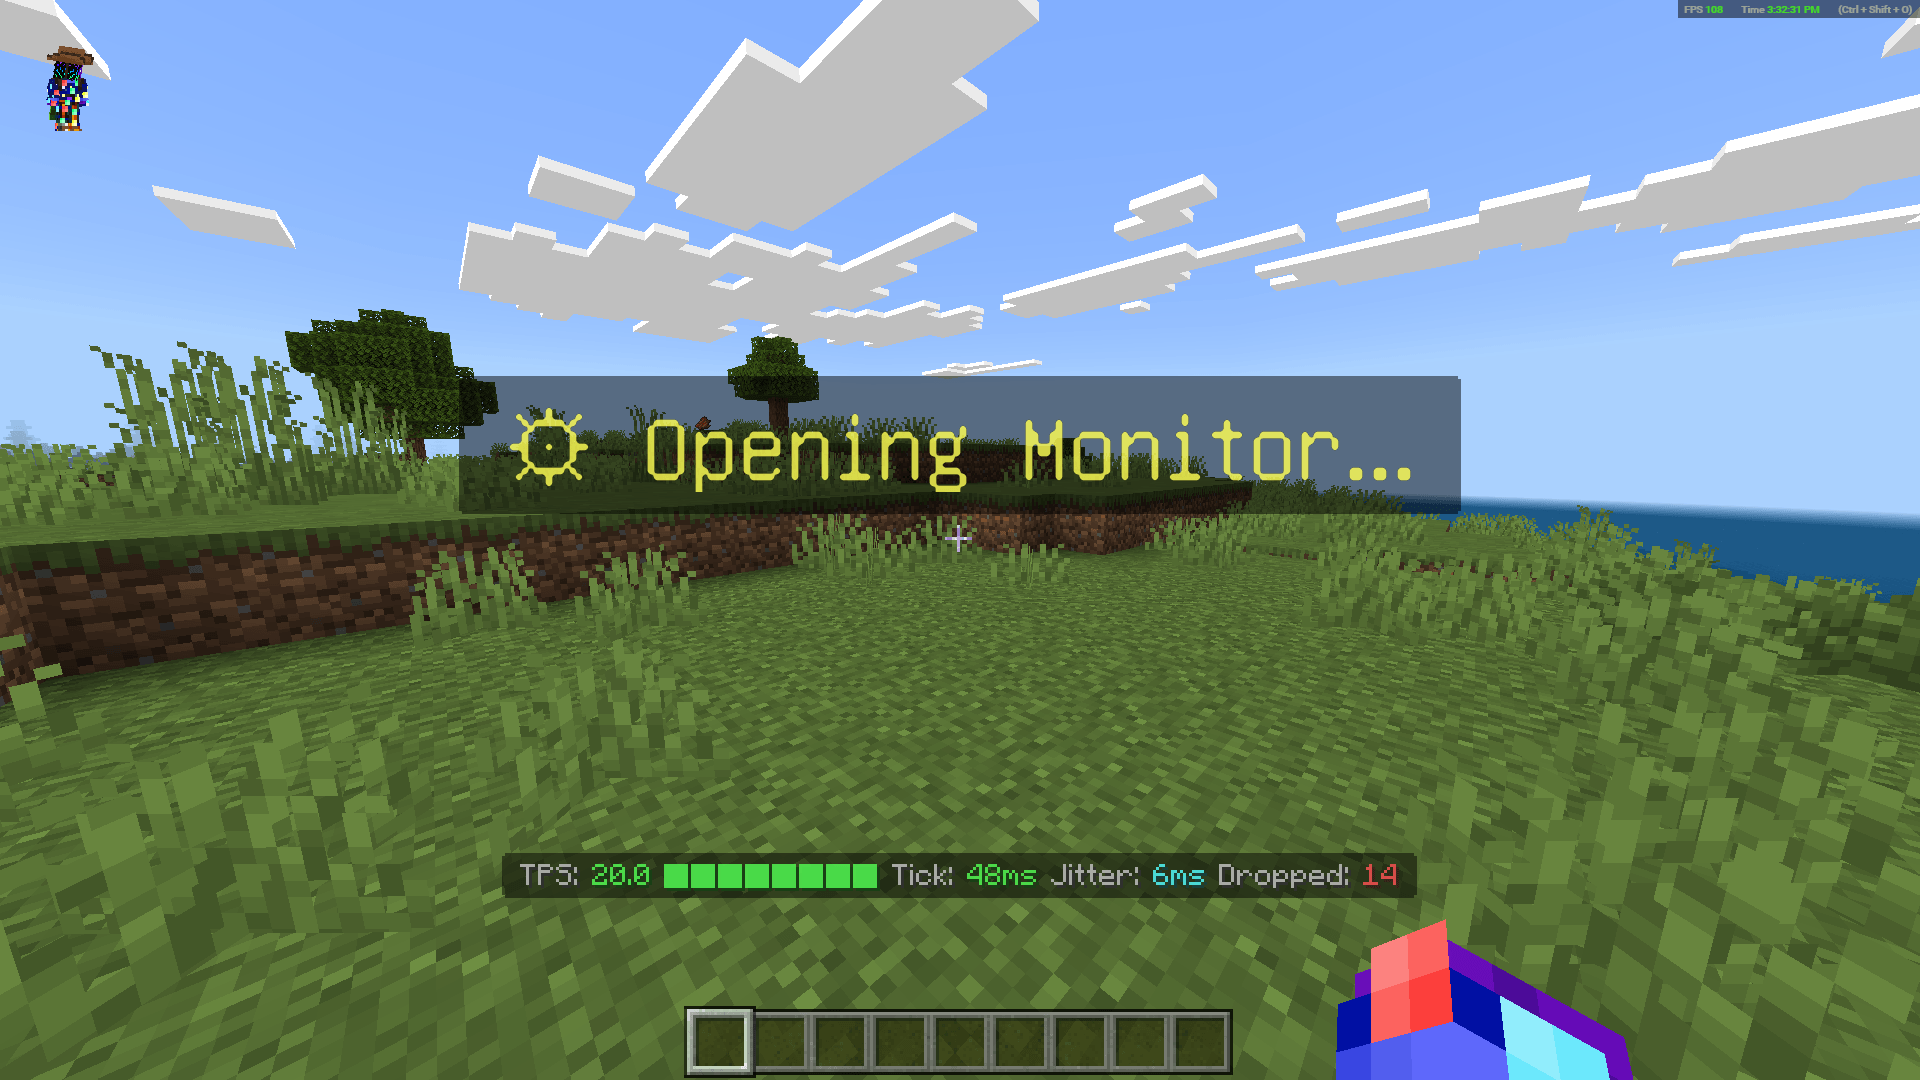
Live action bar HUD – shows TPS, tick milliseconds, jitter, dropped ticks, and entity load.
Controller‑friendly menu – hold sneak (Left Stick / Shift) for 1.5 seconds to open.
Per‑player persistent settings – your display mode, alert threshold, and alert toggle survive rejoins and server restarts.
12 developer tools – script event profiler, flame graph, dynamic property monitor, entity tracker, chunk heatmap, command timer, async queue viewer, pack overlap detector, lag timeline, memory leak detector, command flame chart, AI performance advisor, and a unified dev tools menu.
📥 Installation
Download the .mcaddon file
Enable the behaviour pack in your world.
Enable Beta APIs in world settings (required for @minecraft/server-ui).
Join the world – you’ll see a welcome message:
[TPS Monitor] Loaded! Hold sneak to open menu.
Hold sneak (Left Stick on controller, Shift on keyboard) for 1.5 seconds → the menu appears.
✅ Works on Windows 10/11, Xbox, PlayStation, Switch, Mobile, and Bedrock Dedicated Servers.
🖥️ Action Bar HUD – 5 Display Modes
Mode What You See
FULL TPS + health bar + tick ms + jitter + dropped ticks
COMPACT Health bar + TPS only
GRAPH ASCII tick history (braille blocks) + TPS
PLAYER Nearby entities + TPS + your estimated load %
OFF Hides the action bar
Change mode: menu → 📊 Display Mode → select new mode (saved automatically).
🎮 Menu – How to Use
Hold sneak for 1.5 seconds → menu opens.
Navigate with D‑Pad / arrow keys.
Press A / Enter to select, B / Escape to close.
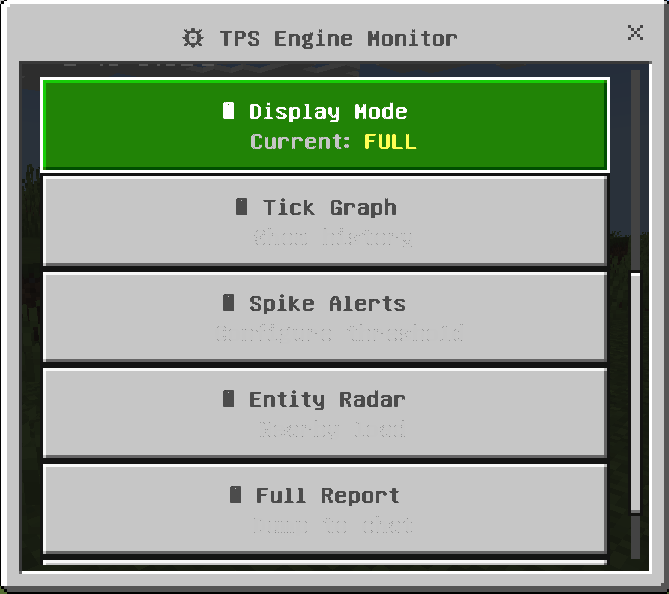
Menu Buttons
Button Action
📊 Display Mode Change action bar layout (saved per player)
📈 Tick Graph Show tick delta history (last 40 ticks)
🔔 Spike Alerts Adjust threshold (55–250ms) and enable/disable
👥 Entity Radar List nearby entity types with counts
📋 Full Report Dump performance report to chat
🛠 Dev Tools Open the developer tools menu (12 tools)
✖ Close Exit the menu
🛠 Developer Tools – Full Breakdown
Access: menu → 🛠 Dev Tools
# Tool What It Does When To Use
1 📊 Script Event Profiler Shows avg/max time & call count for every /scriptevent. Find slow custom commands in your addon.
2 🔥 Flame Graph Estimates % of tick budget spent in your script callbacks. Optimise runInterval / event handlers.
3 💾 Dynamic Props Lists all dynamic properties (world + players) with byte sizes. Avoid hitting 65KB limit & corrupting saves.
4 🐛 Entity Tracker (toggle) Monitors entity spawns & removals per second. Report with /scriptevent tps:entityreport. Find entity leaks (e.g., infinite arrows).
5 🗺️ Chunk Heatmap Shows entity density per dimension as a bar chart. Locate laggy farms / mob grinders.
6 ⏱️ Command Timer Wrap any command with /scriptevent tps:exec <command> to measure runtime. Profile slow commands.
7 📋 Async Queue Explains Bedrock’s deferred callback limits + gives optimisation tips. Reduce runTimeout/runInterval spam.
8 📦 Pack Overlap Register behaviour packs & detect duplicate names / conflicts. Debug addon compatibility.
9 📈 Lag Timeline (CSV) Outputs CSV of TPS, tick ms, entities, script load (every 5s). Paste into Excel for before/after graphs.
10 🧠 Memory Leak Detector Takes snapshots; run again later to compare growth. Catch addons that never clean up data.
11 🔥 Command Flame Chart Tracks chat commands (starting with /) + tps:exec + scriptevents. Shows avg/max times. Profile all commands from players or console.
12 🤖 AI Performance Advisor Analyses metrics & gives plain‑English optimisation suggestions. Quick health check – “what should I fix?”
13 ⬅ Back Returns to main menu. –
📜 Script Events (For Operators)
Run these from chat (requires operator permissions):
Command Action
/scriptevent tps:menu Open menu (same as sneak‑hold).
/scriptevent tps:report Dump full performance report.
/scriptevent tps:graph Show tick history graph.
/scriptevent tps:reset Reset dropped ticks, peak lag, and tick history.
/scriptevent tps:mode <full|compact|graph|player|off> Change display mode instantly.
/scriptevent tps:exec <command> Time any command (requires Command Timer enabled in Dev Tools).
/scriptevent tps:entityreport Show spawn/despawn counts (requires Entity Tracker enabled).
/scriptevent tps:registerpack <name> Register a behaviour pack for conflict detection.
/scriptevent tps:listpacks List all registered packs.
/scriptevent tps:flametoggle Enable/disable chat command tracking (Command Flame Chart).
⚙️ How to Use the Developer Tools – Step by Step
🔍 Find a Slow Script Event
Run /scriptevent tps:menu → 🛠 Dev Tools → 📊 Script Event Profiler.
See which events take the most time (avg / max).
Optimise that event’s code.
🐛 Detect a Memory Leak
Dev Tools → 🧠 Memory Leak Detector → take baseline snapshot.
Play normally for 5–10 minutes.
Run the detector again – it will show any growth in dynamic properties or player state.
If growth is detected, check addons that store data per player without cleaning up on leave.
📈 Measure Optimisation Impact
Dev Tools → 📈 Lag Timeline → copy the CSV output.
Paste into Excel, create a line chart of TPS over time.
Make changes to your addon, then compare new CSV to see improvement.
🤖 Get AI Advice
Dev Tools → 🤖 AI Performance Advisor – the script will analyse current metrics and suggest concrete actions (e.g., “reduce view distance”, “optimise script events”, “cull entities”).
🔧 Troubleshooting
Problem Solution
Action bar doesn’t show anything menu → 📊 Display Mode → choose not “Off”.
Settings reset after rejoin Make sure dynamic properties are enabled. The script saves per player automatically.
chatSend event not available warning Ignore – only chat command tracking is disabled. All other tools work.
Entity Tracker shows nothing Enable it in Dev Tools first (🐛 Entity Tracker). Then run /scriptevent tps:entityreport.
Command Timer doesn’t work Enable it in Dev Tools (⏱️ Command Timer), then use /scriptevent tps:exec <command>.
Memory Leak Detector says “no baseline” Run it once to take a snapshot, then again later to compare.
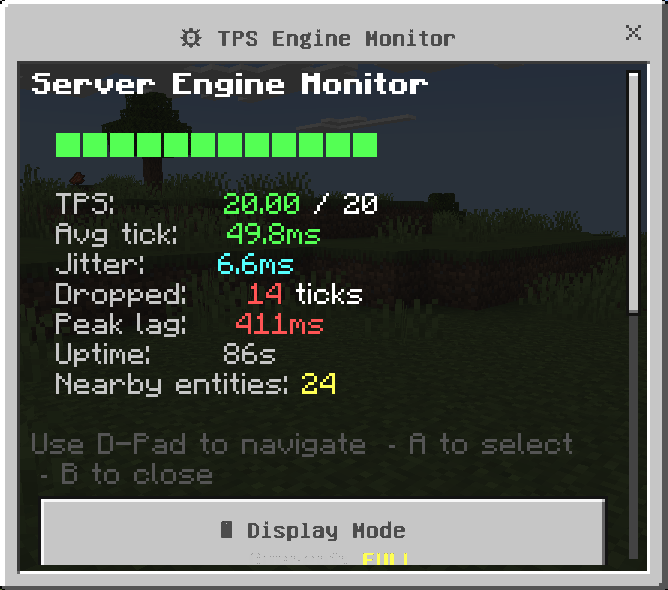
📋 Full Performance Report Example
When you run /scriptevent tps:report or use the 📋 Full Report button, you’ll see:
════ TPS Report ════
Time: 2025-01-15T14:32:07.123Z
Uptime: 1245s
TPS: 19.8/20
Avg tick: 50.2ms
Jitter: 2.3ms
Dropped: 12
Peak: 87ms
Nearby: 34
Load est: 17%
════════════════════
📈 How to Use the Lag Timeline (CSV) Feature
The Lag Timeline captures a snapshot of server performance every 5 seconds (100 ticks) and stores up to 60 snapshots (5 minutes of history). You can export this data as CSV (Comma-Separated Values) and paste it into Excel, Google Sheets, or any spreadsheet program to create beautiful graphs and track performance over time.
🎮 Step 1: Access the Lag Timeline
Open the Main menu – hold sneak (Left Stick / Shift) for 1.5 seconds.
Select 🛠 Dev Tools.
Choose 📈 Lag Timeline (CSV).
The script will output something like this in chat:
=== Historical Lag Timeline (CSV) ===
Time,TPS,AvgTick(ms),Entities,ScriptLoad(ms)
14:32:05,19.8,50.2,34,1.23
14:32:10,19.7,50.8,36,1.45
14:32:15,18.9,52.9,42,2.10
14:32:20,19.2,52.1,41,1.98
...
📊 Step 2: Copy the Data
The output is already in CSV format – the first line is the header (column names), and each following line is a snapshot.
Copy all lines from Time,TPS,AvgTick(ms),Entities,ScriptLoad(ms) down to the last line.
💡 Tip: On some platforms, chat messages are truncated. If you have many snapshots, you may need to scroll up. The script shows the last 20 snapshots – enough for a 100‑second timeline.
📁 Step 3: Paste into a Spreadsheet
Microsoft Excel
Open a new blank workbook.
Click on cell A1.
Paste the copied text (Ctrl+V / Cmd+V).
Excel should automatically split the data into columns. If not, go to Data → Text to Columns → choose Delimited → check Comma → Finish.
Google Sheets
Open sheets.new.
Click on cell A1.
Paste the copied text.
If it doesn’t split automatically, go to Data → Split text to columns → choose Comma.
Manual split (any editor)
The data is comma‑separated, so you can also open it in a text editor and replace commas with tabs, then paste into a spreadsheet.
📈 Step 4: Create a Chart
Once the data is in columns, you can visualise any metric over time.
Example: TPS over time
Select the Time column (A) and the TPS column (B).
Insert a line chart (Excel: Insert → Line Chart; Google Sheets: Insert → Chart → Line chart).
Customise the chart title, axis labels, and colours.
You can also chart:
AvgTick(ms) – how tick time changes (should stay near 50ms).
Entities – entity count trend (spikes = mob farms / events).
ScriptLoad(ms) – script execution overhead (should be low).
🔍 Step 5: Interpret the Data
Column What It Means Healthy Range
Time Timestamp of snapshot (your local time) –
TPS Ticks Per Second (20 = perfect) ≥ 18 (good), < 15 (lag)
AvgTick(ms) Average tick time over last 20 ticks ≤ 50ms (target), > 55ms (lag)
Entities Total nearby entities (sum across all players) Varies, but sudden spikes indicate issues
ScriptLoad(ms) Estimated time spent in script callbacks per tick < 5ms (good), > 10ms (optimise)
🧪 Example Use Cases
Before / After Optimisation
Run /scriptevent tps:reset to clear stats.
Let the server run for 5 minutes with your addon before changes.
Open Lag Timeline and copy the CSV – save as “before.csv”.
Make optimisation changes to your addon.
Reset stats again, run for 5 minutes, copy CSV – save as “after.csv”.
Overlay both charts in Excel to see improvement.
Find Entity Spikes
Chart Entities over time. If you see a sudden jump (e.g., from 40 to 300 entities), check what happened at that time (a farm activated? a player entered a loaded area?).
Monitor Script Performance
If ScriptLoad(ms) is consistently above 10ms, your script callbacks are using too much tick budget. Use the Script Event Profiler or Flame Graph to pinpoint the culprit.
⚙️ Advanced: Change the Snapshot Interval
By default, the script takes a snapshot every 5 seconds (100 ticks at 20 TPS). If you want more or less frequent snapshots, you can change the constant TIMELINE_INTERVAL at the top of main.js:
javascript
const TIMELINE_INTERVAL = 100; // 100 ticks = 5 seconds at 20 TPS
Lower = more snapshots (more detail, but more memory).
Higher = longer history (but less resolution).
❓ Troubleshooting
Problem Solution
“Not enough data yet. Wait a few minutes.” The script needs at least one snapshot. Wait 5 seconds after loading.
CSV output is cut off in chat Minecraft limits message length. The script only shows the last 20 snapshots – that’s still 100 seconds of data.
Numbers don’t separate into columns Use “Text to Columns” (Excel) or “Split text to columns” (Google Sheets) with comma as delimiter.
ScriptLoad(ms) shows 0 It averages over the last second. If no script callbacks ran, it may be 0.
=============================================================================================================
📦 How to Use the Pack Overlap Detector
The Pack Overlap Detector helps addon developers identify duplicate or conflicting behavior pack registrations. It’s useful when you’re testing multiple addons that might share the same internal name or when you want to ensure your pack doesn’t conflict with another.
🎯 What Does It Detect?
Duplicate pack names – If you register the same pack name twice (by accident or because two packs share an identifier).
Missing registrations – It doesn’t automatically scan all packs; you must manually register each pack you care about. This is by design – the script cannot read active pack names from the game’s internal data.
⚠️ Important: The detector is manual. You tell it which packs are active. It then checks for duplicates among the names you provide. This is perfect for developers who know their pack names and want to avoid collisions.
📋 Step-by-Step Usage
Step 1: Open the Main Menu
Hold sneak (Left Stick on controller, Shift on keyboard) for 1.5 seconds.
The Main menu appears.
Step 2: Navigate to Dev Tools
Select 🛠 Dev Tools (bottom row, second from the right).
Step 3: Choose Pack Overlap Detector
Select 📦 Pack Overlap Detector (button #8 in the list).
The script will show something like:
=== Behavior Pack Overlap Detector ===
Manual registration required. Use /scriptevent tps:registerpack <name> to add your pack.
Then /scriptevent tps:listpacks to see conflicts.
No packs registered yet.
Step 4: Register Your Behaviour Packs
You need to register each pack you want to track. Use the following command in chat (you need operator permissions):
/scriptevent tps:registerpack <your-pack-name>
Example:
/scriptevent tps:registerpack MyAwesomeAddon
/scriptevent tps:registerpack UtilityLib
/scriptevent tps:registerpack AnotherPack
You can register as many as you like. The names are stored in the world’s dynamic properties (so they persist across server restarts).
Step 5: List Registered Packs (Optional)
To see all currently registered pack names:
/scriptevent tps:listpacks
Output example:
Registered packs: MyAwesomeAddon, UtilityLib, AnotherPack
Step 6: Check for Conflicts (Duplicates)
Run the Pack Overlap Detector again from the Dev Tools menu (or just use /scriptevent tps:listpacks and look for duplicates manually). If you accidentally register the same name twice, the detector will warn you:
⚠️ Duplicate pack names: MyAwesomeAddon
If no duplicates are found:
No conflicts detected.
🧪 Example Workflow for Addon Development
Scenario: You are developing two addons that both use a common library, and you want to ensure they don’t conflict.
Register both addons and the library:
/scriptevent tps:registerpack RPG_System
/scriptevent tps:registerpack Quest_System
/scriptevent tps:registerpack RPG_Core_Lib
Run the Pack Overlap Detector – it will confirm no duplicates.
Later, you add a third addon that also claims the name RPG_Core_Lib. You register it:
/scriptevent tps:registerpack RPG_Core_Lib
Run the detector again – now it will warn:
⚠️ Duplicate pack names: RPG_Core_Lib
Rename one of the conflicting packs (in its manifest or registration) and remove the duplicate registration (or just re‑register with a unique name).
🔧 Managing Registered Packs
Remove a Pack (Not Built‑In)
The script does not include a removal command, but you can clear all registrations by resetting the dynamic property:
/scriptevent tps:resetpacks
(Note: This command is not currently implemented – you would need to add it manually or clear via script. For now, if you need to remove a specific pack, you can either:
Restart the world and register only the packs you want.
Add your own /scriptevent tps:removepack <name> by editing the script.)
View All Registered Packs
/scriptevent tps:listpacks
❓ Frequently Asked Questions
Q: Does this detect conflicts automatically?
A: No – you must manually register the packs you care about. The script cannot read all active packs from the game engine. This is a limitation of the Bedrock Script API.
Q: What counts as a “conflict”?
A: Currently, only exact duplicate names are detected. You could extend the script to also check for naming patterns or version mismatches.
Q: Can I use this to detect duplicate behaviour packs in a Realm?
A: Yes – as long as you know the pack names and register them. It won’t automatically find packs installed on the Realm, but you can manually register each one.
Q: Why do I need to register manually?
A: The Bedrock Script API does not provide a way to list active behaviour packs from within a script. Manual registration is the only reliable method.
Q: Are registrations saved?
A: Yes – they are stored in the world’s dynamic properties, so they survive server restarts.
💡 Pro Tips
Use consistent naming – e.g., author_pack_name to avoid accidental collisions.
Register packs during development – keep a list of your active addons in a text file, then register them once.
Combine with version tracking – you could extend the script to also store version numbers and warn if versions mismatch.
🛠 Extending the Feature (For Advanced Users)
If you want to add a removal command, insert this into main.js inside the script event handler:
javascript
else if (id === "tps:removepack") {
let packs = [];
try { const raw = mc.world.getDynamicProperty("tps:registeredPacks"); if (raw) packs = JSON.parse(raw); } catch(e) {}
const name = event.message.trim();
if (!name) { player.sendMessage("§cUsage: /scriptevent tps:removepack <name>"); return; }
const index = packs.indexOf(name);
if (index !== -1) packs.splice(index, 1);
mc.world.setDynamicProperty("tps:registeredPacks", JSON.stringify(packs));
player.sendMessage(`§aRemoved pack: ${name}`);
}
Then use /scriptevent tps:removepack MyPack
=============================================================================================================
=============================================================================================================
🧪 Compatibility & Requirements
Minecraft Bedrock 1.20.70 or higher (1.21+ recommended).
❓ Frequently Asked Questions
Q: Does this work on Realms?
A: Yes, if the Realm owner installs the behaviour pack and enables Beta APIs.
Q: Can I use this on a dedicated server (BDS)?
A: Yes, works perfectly on BDS with scripts enabled.
Q: Will this cause lag?
A: The monitor is very light. Entity scanning is throttled to once per second. Heavy features (entity tracker, command flame chart) are off by default – toggle them only when needed.
Q: I’m not a developer – can I still use it?
A: Absolutely! The action bar HUD and spike alerts are useful for any player who wants to see server performance.
Q: How do I know which display mode is active?
A: Open the menu – the 📊 Display Mode button shows the current mode in its subtitle.
Q: Can I suggest a new feature?
A: Yes! Leave a comment on CurseForge.
Q: Im getting "[Scripting][warning]-TPS Monitor: chatSend event not available. Command flame chart for chat commands disabled." When loading in my world
A: This is normal Operation.
💬 Support & Feedback
CurseForge comments – for general questions.