
Just another pie graph screenshot.
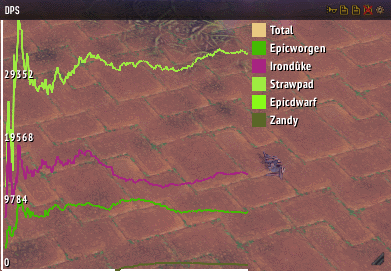
The historic line display stores the last 30 states for each row internally. Can be used with any mode. Navigate the normal Skada way on the legends, or by using the window buttons.
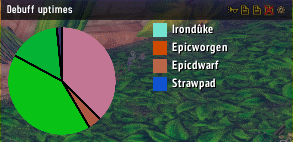
The pie graph display is very simple. Can be used with any mode. Navigate the normal Skada way on the legends, or by using the window buttons.
Description
Adds graph display systems to Skada. Uses Cryect's excellent LibGraph-2.0. To use these, create a new window in Skada. While doing so, choose one of the new display systems instead of the built-in bar display. Both use the normal Skada way of navigating, but also have buttons for it. Scrolling is also done the Skada way (mousewheel).
Currently there are two new display systems:
Historic line display is roughly equivalent to the realtime graphs in Recount. No permanent additional data is stored, only transiently while displaying. You can find an option allowing you to switch between "RealTime" and "Total data" modes in the options panel.
Pie display is a simple pie chart.
Feel free to report any issue you might encounter. If you can't find what you're looking for in the graphs, please let me know.
The Skada Graphs Team


Owner