WoW Task Manager
- By
WoW Task Manager brings desktop-style performance diagnostics to Azeroth. Track FPS, frame times, 1% lows, addon CPU and memory, latency, event spikes, and stutters with live graphs, a performance timeline, and a flight recorder.
Screenshot 2026-09-04 124333.png
Screenshot 2026-09-04 124431.png
Screenshot 2026-09-04 124351.png
Screenshot 2026-09-04 124413.png
Screenshot 2026-09-04 124446.png
Description
Support my Work via Donations :)

Join my Discord
WOW TASK MANAGER
Advanced Performance Monitoring & Diagnostics for World of Warcraft
Understand your performance. Identify bottlenecks. Take control.
WoW Task Manager is a powerful, modern performance monitoring and diagnostic addon that brings the familiar experience of a desktop task manager directly into World of Warcraft.
Monitor your FPS, frame times, addon CPU usage, memory consumption, latency, and event activity through an advanced interface designed to help you understand what's happening behind the scenes.
But WoW Task Manager goes far beyond displaying a few performance numbers.
With intelligent stutter detection, detailed performance timelines, historical session tracking, and an integrated flight recorder, you can investigate performance problems instead of simply wondering why your game suddenly started lagging.
Stop guessing. Start understanding your performance.
Why WoW Task Manager?
Ever wondered which addon is slowing down your game?
You're in the middle of a raid. Your FPS suddenly drops. The game freezes for half a second. Everything returns to normal.
But what actually happened?
Was it an addon? A sudden memory spike? Network latency? An unusual burst of game events?
Traditional FPS counters only tell you that something went wrong.
WoW Task Manager helps you investigate why.
By recording performance metrics over time and highlighting unusual activity, it provides valuable insights into what happened before, during, and after a performance issue.
Whether you're troubleshooting addon conflicts, investigating microstutters, or simply trying to optimize your interface, WoW Task Manager gives you the tools to explore your game's performance in detail.
Key Features
📊 Real-Time Performance Dashboard
Your entire game's performance at a glance.
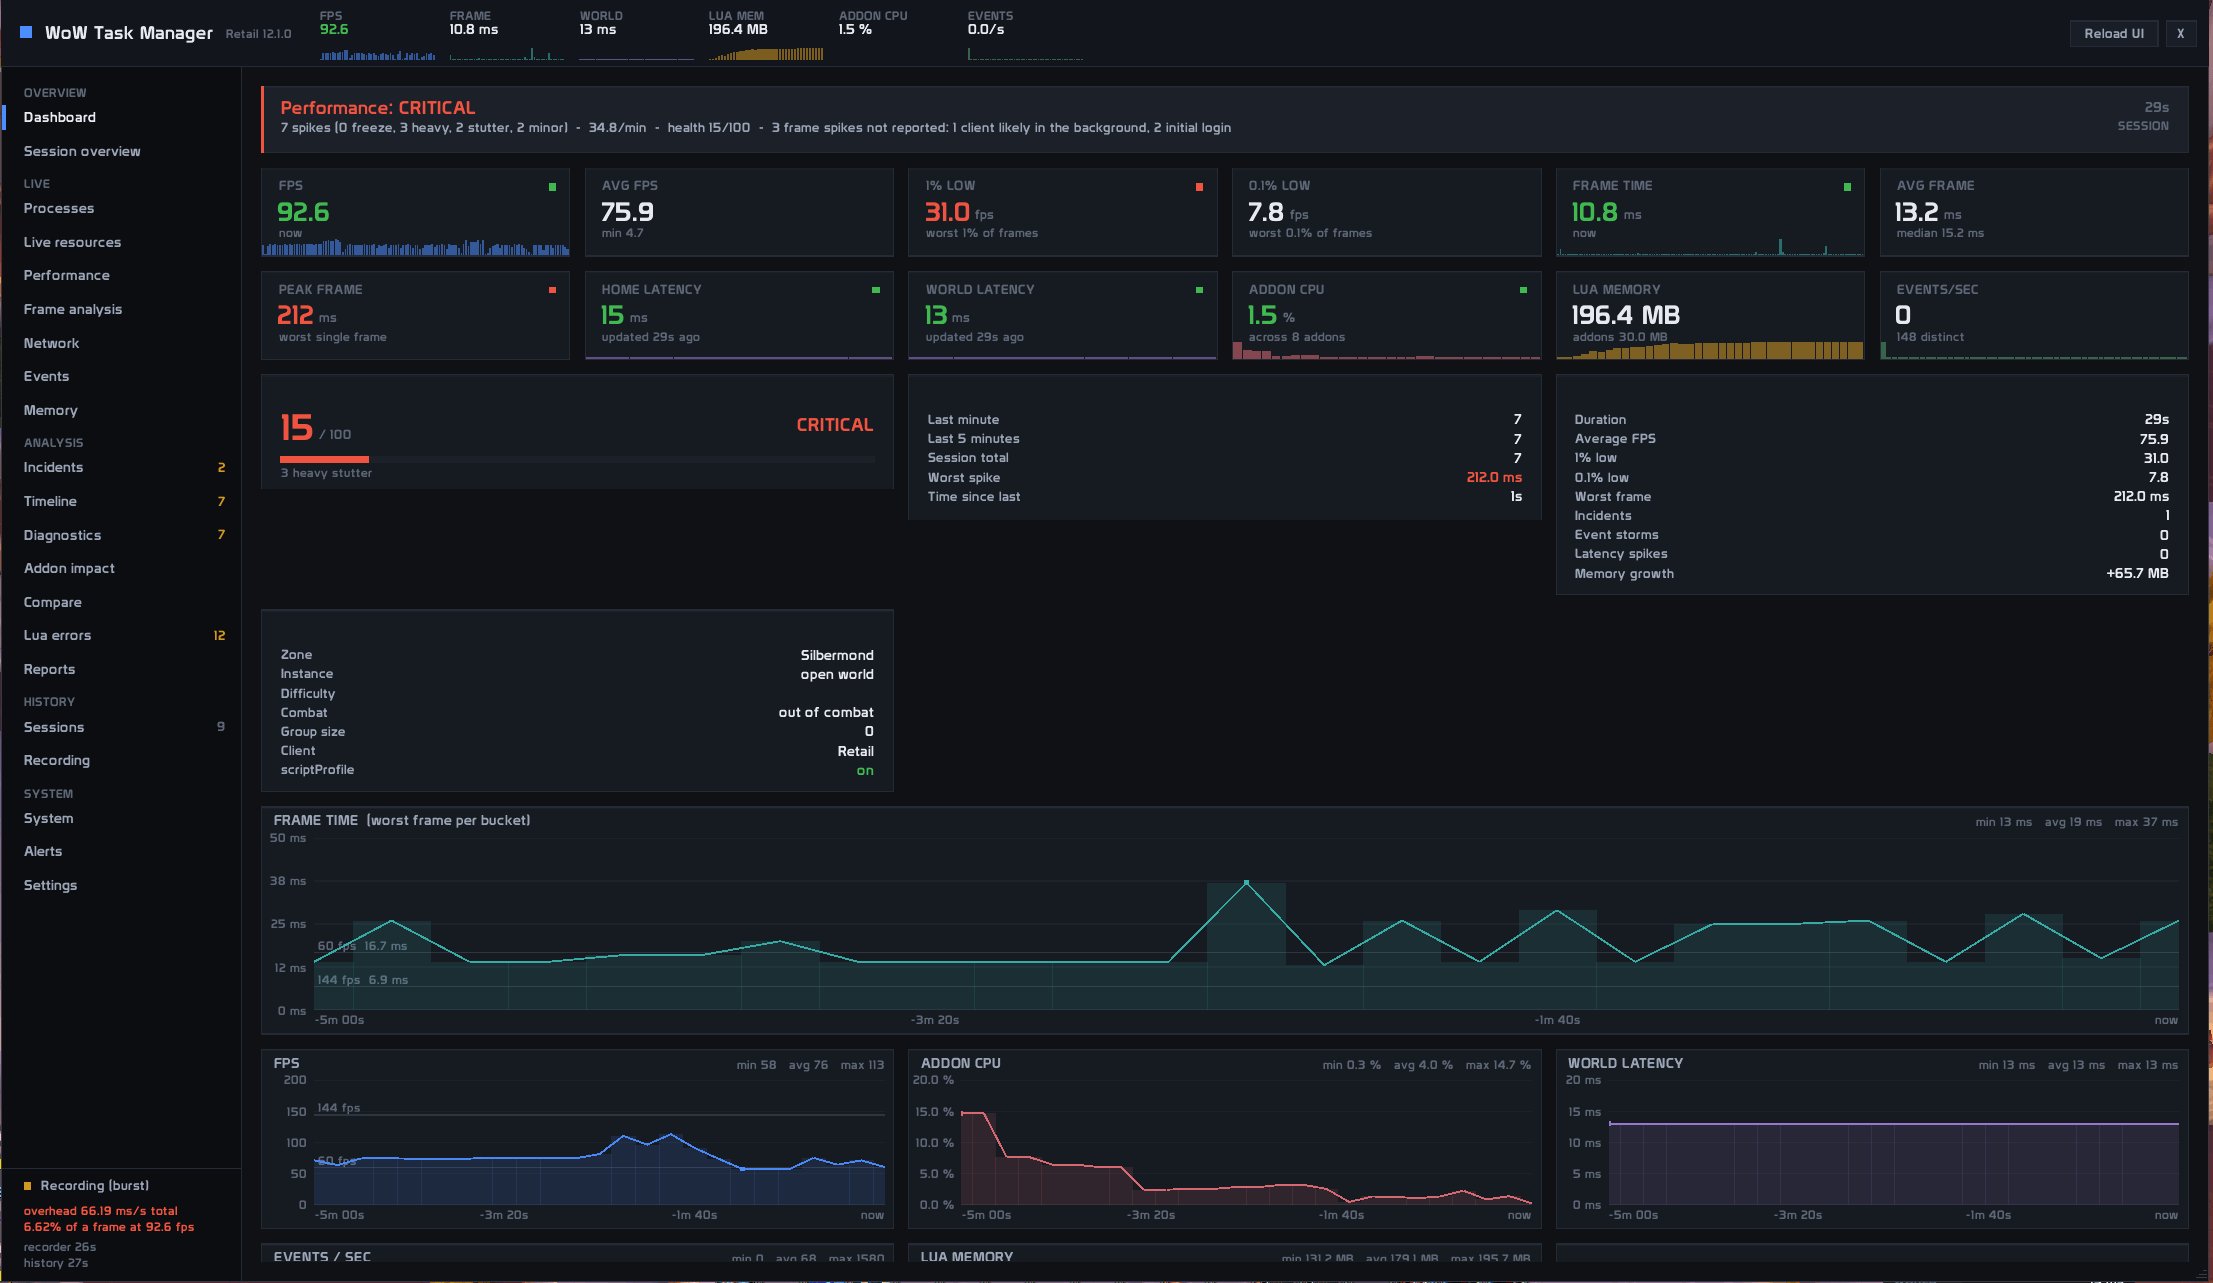
Monitor essential performance statistics through a clean, responsive dashboard inspired by modern system monitoring software.
Track your current FPS, frame times, 1% low FPS, Home and World latency, addon memory consumption, addon CPU activity, and events per second.
Integrated graphs visualize performance changes over time, helping you recognize trends and sudden fluctuations that would otherwise go unnoticed.
Instead of relying on isolated numbers, see how your game actually behaves while you're playing.
⚡ Advanced FPS & Frame Time Analysis
High FPS doesn't always mean smooth gameplay.
A game running at 120 FPS can still feel terrible when individual frames take significantly longer to render.
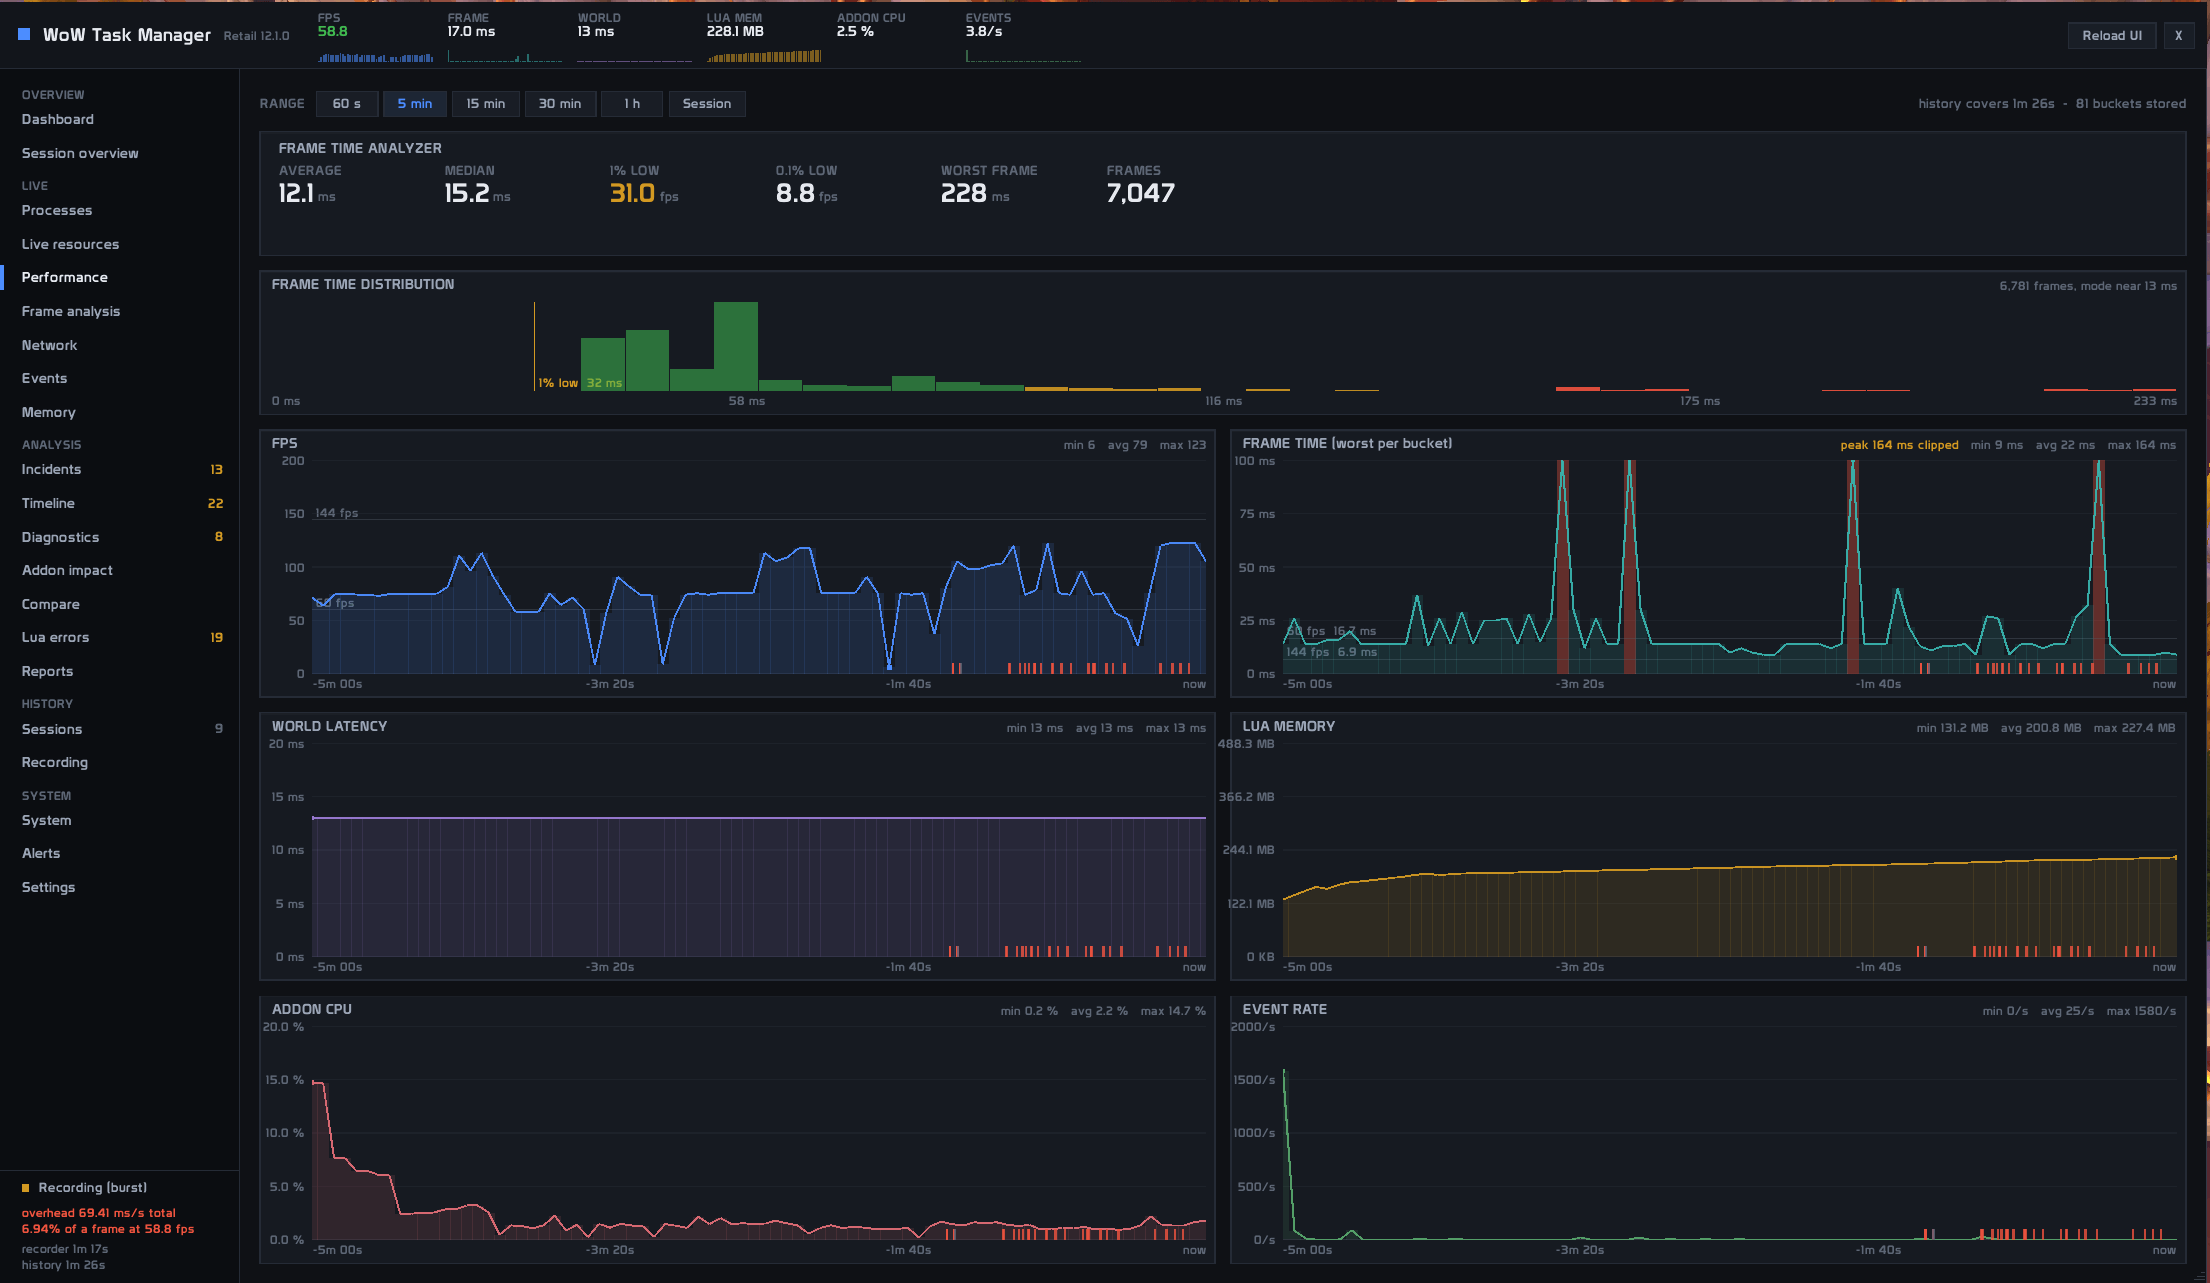
WoW Task Manager continuously analyzes frame times to help identify irregular frame delivery, temporary freezes, and performance instability.
Detailed measurements help reveal microstutters, sudden frame-time spikes, heavy stutters, and freezes.
Specialized performance graphs preserve short spikes that traditional averaged FPS displays might hide.
Understand not only how fast your game runs, but also how consistently it performs.
🔍 Addon CPU & Memory Monitor
Find out what your addons are doing behind the scenes.
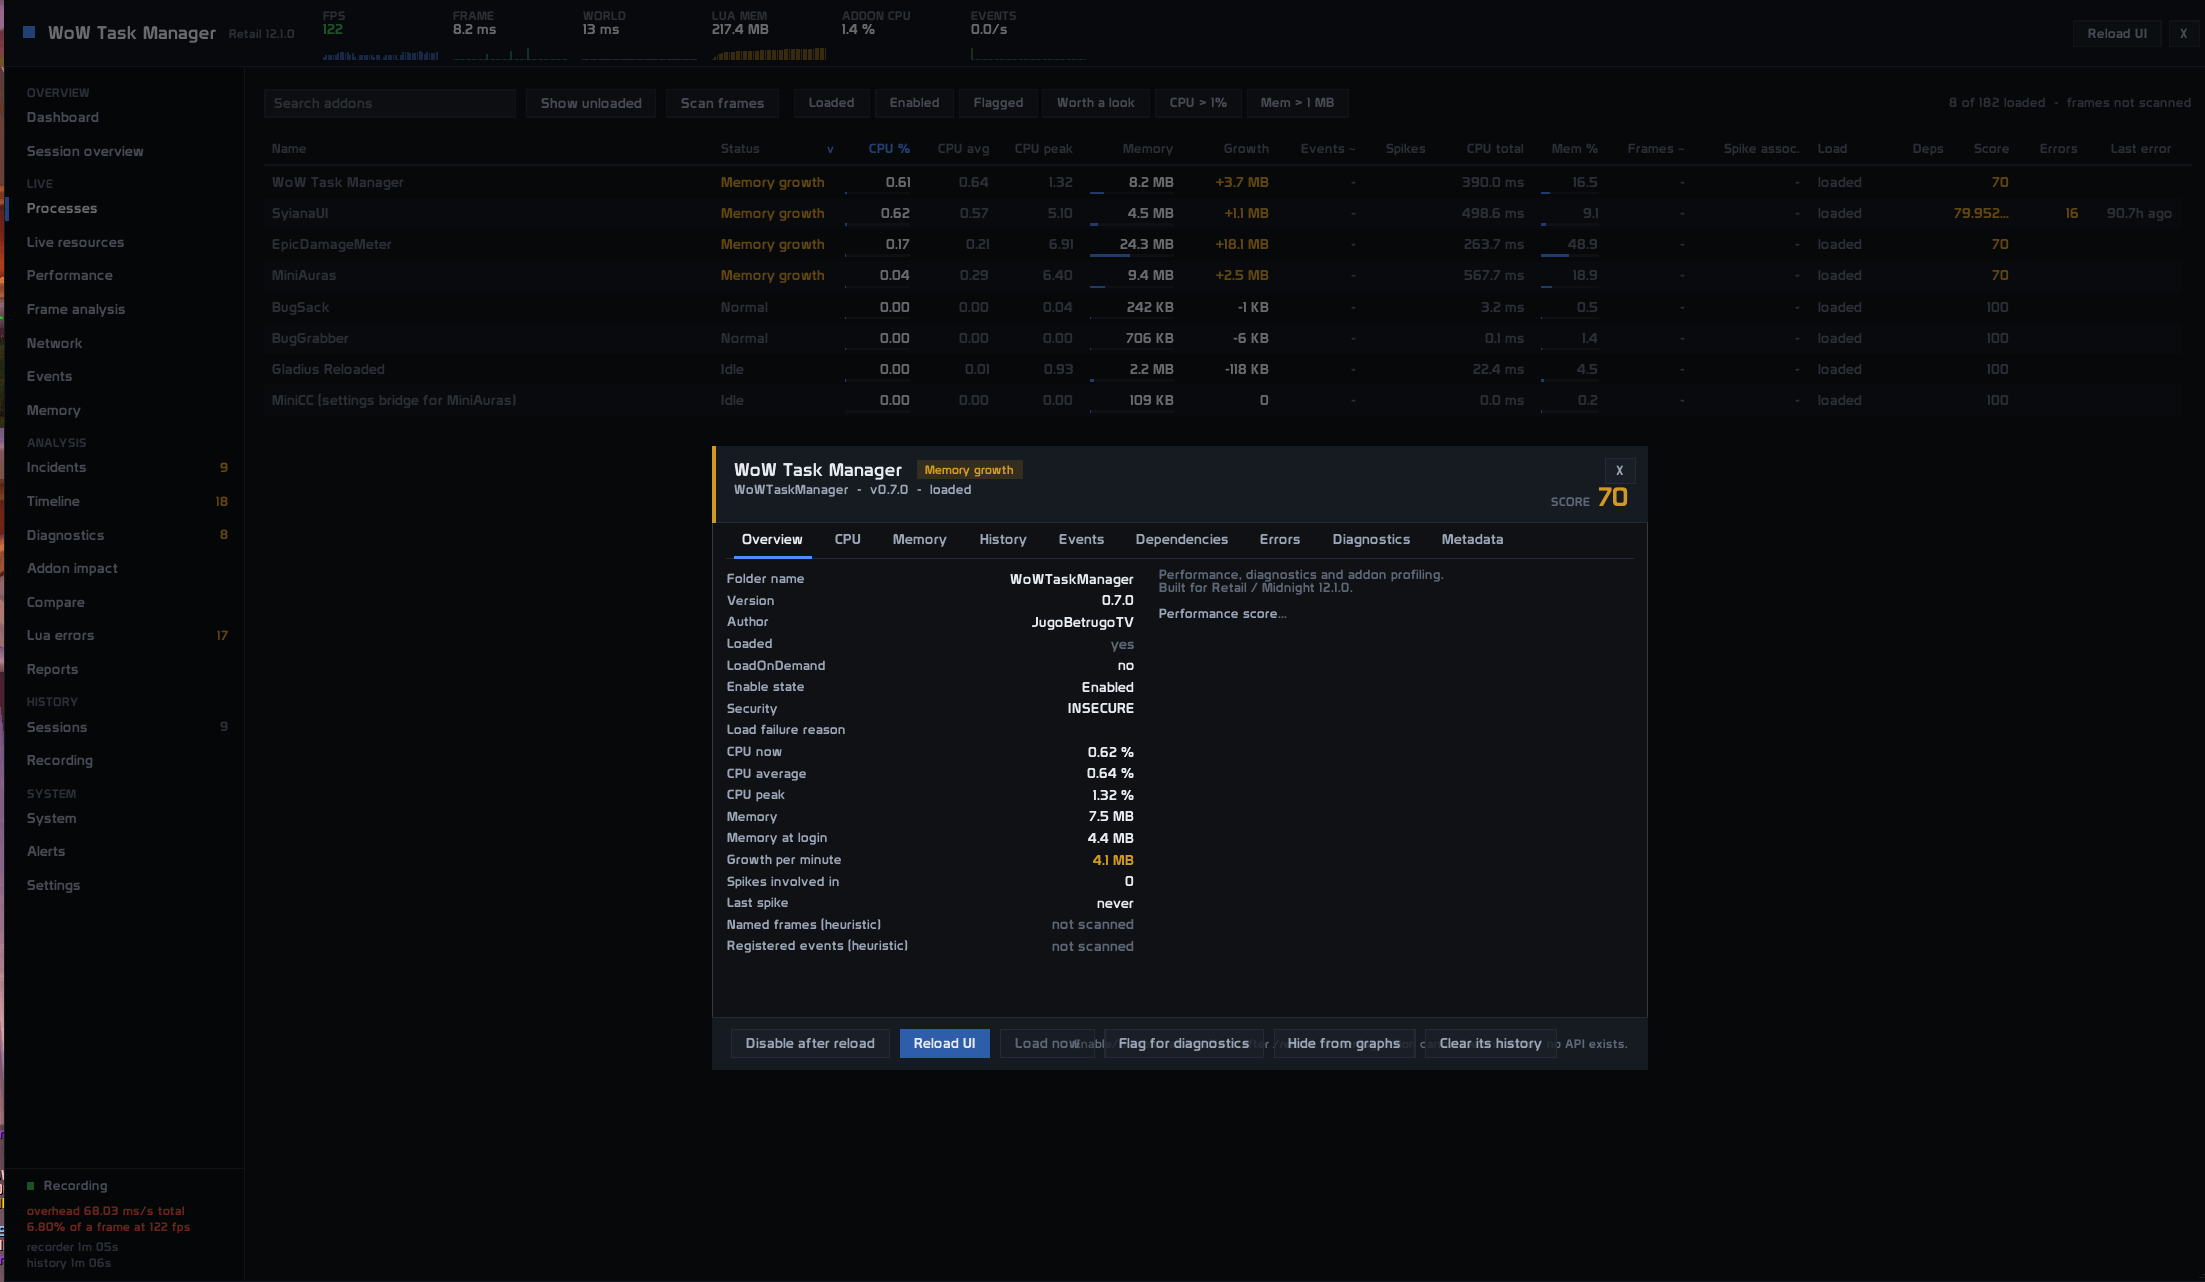
Inspired by the familiar processes view of desktop task managers, WoW Task Manager provides an overview of your loaded addons and their measurable resource usage.
Inspect available CPU statistics, including average and peak usage, alongside memory consumption and memory growth.
Monitor unusual performance activity and examine information about loaded addons and their dependencies.
This makes it easier to identify resource-intensive addons, investigate unexpected memory growth, and narrow down potential sources of performance issues.
Per-addon CPU monitoring requires World of Warcraft's built-in scriptProfile functionality, and available statistics depend on the game client.
🎥 Integrated Flight Recorder
Your game freezes. WoW Task Manager remembers what happened.
One of the most powerful features of WoW Task Manager is its integrated performance flight recorder.
Instead of only displaying live information, the addon continuously maintains a recent history of performance measurements.
When a significant performance spike is detected, the flight recorder captures a diagnostic incident containing information from before and after the event.
Review available FPS, frame times, latency, addon CPU activity, memory usage, and event activity surrounding the incident.
Additional context, such as combat status and zone information, can help establish when and where a problem occurred.
Because the most important performance information is often what happened before you noticed the problem.
📈 Advanced Performance Timeline
See the complete picture.
Explore multiple performance metrics through a detailed timeline that visualizes your game's behavior over time.
Compare FPS, frame times, addon CPU activity, memory consumption, event rates, and latency to discover patterns and possible relationships.
Timeline markers can highlight important events such as frame spikes, latency fluctuations, event storms, combat activity, encounters, and zone transitions.
Instead of manually comparing separate statistics, investigate performance behavior through a unified chronological view.
🚨 Intelligent Stutter Detection
Every stutter tells a story.
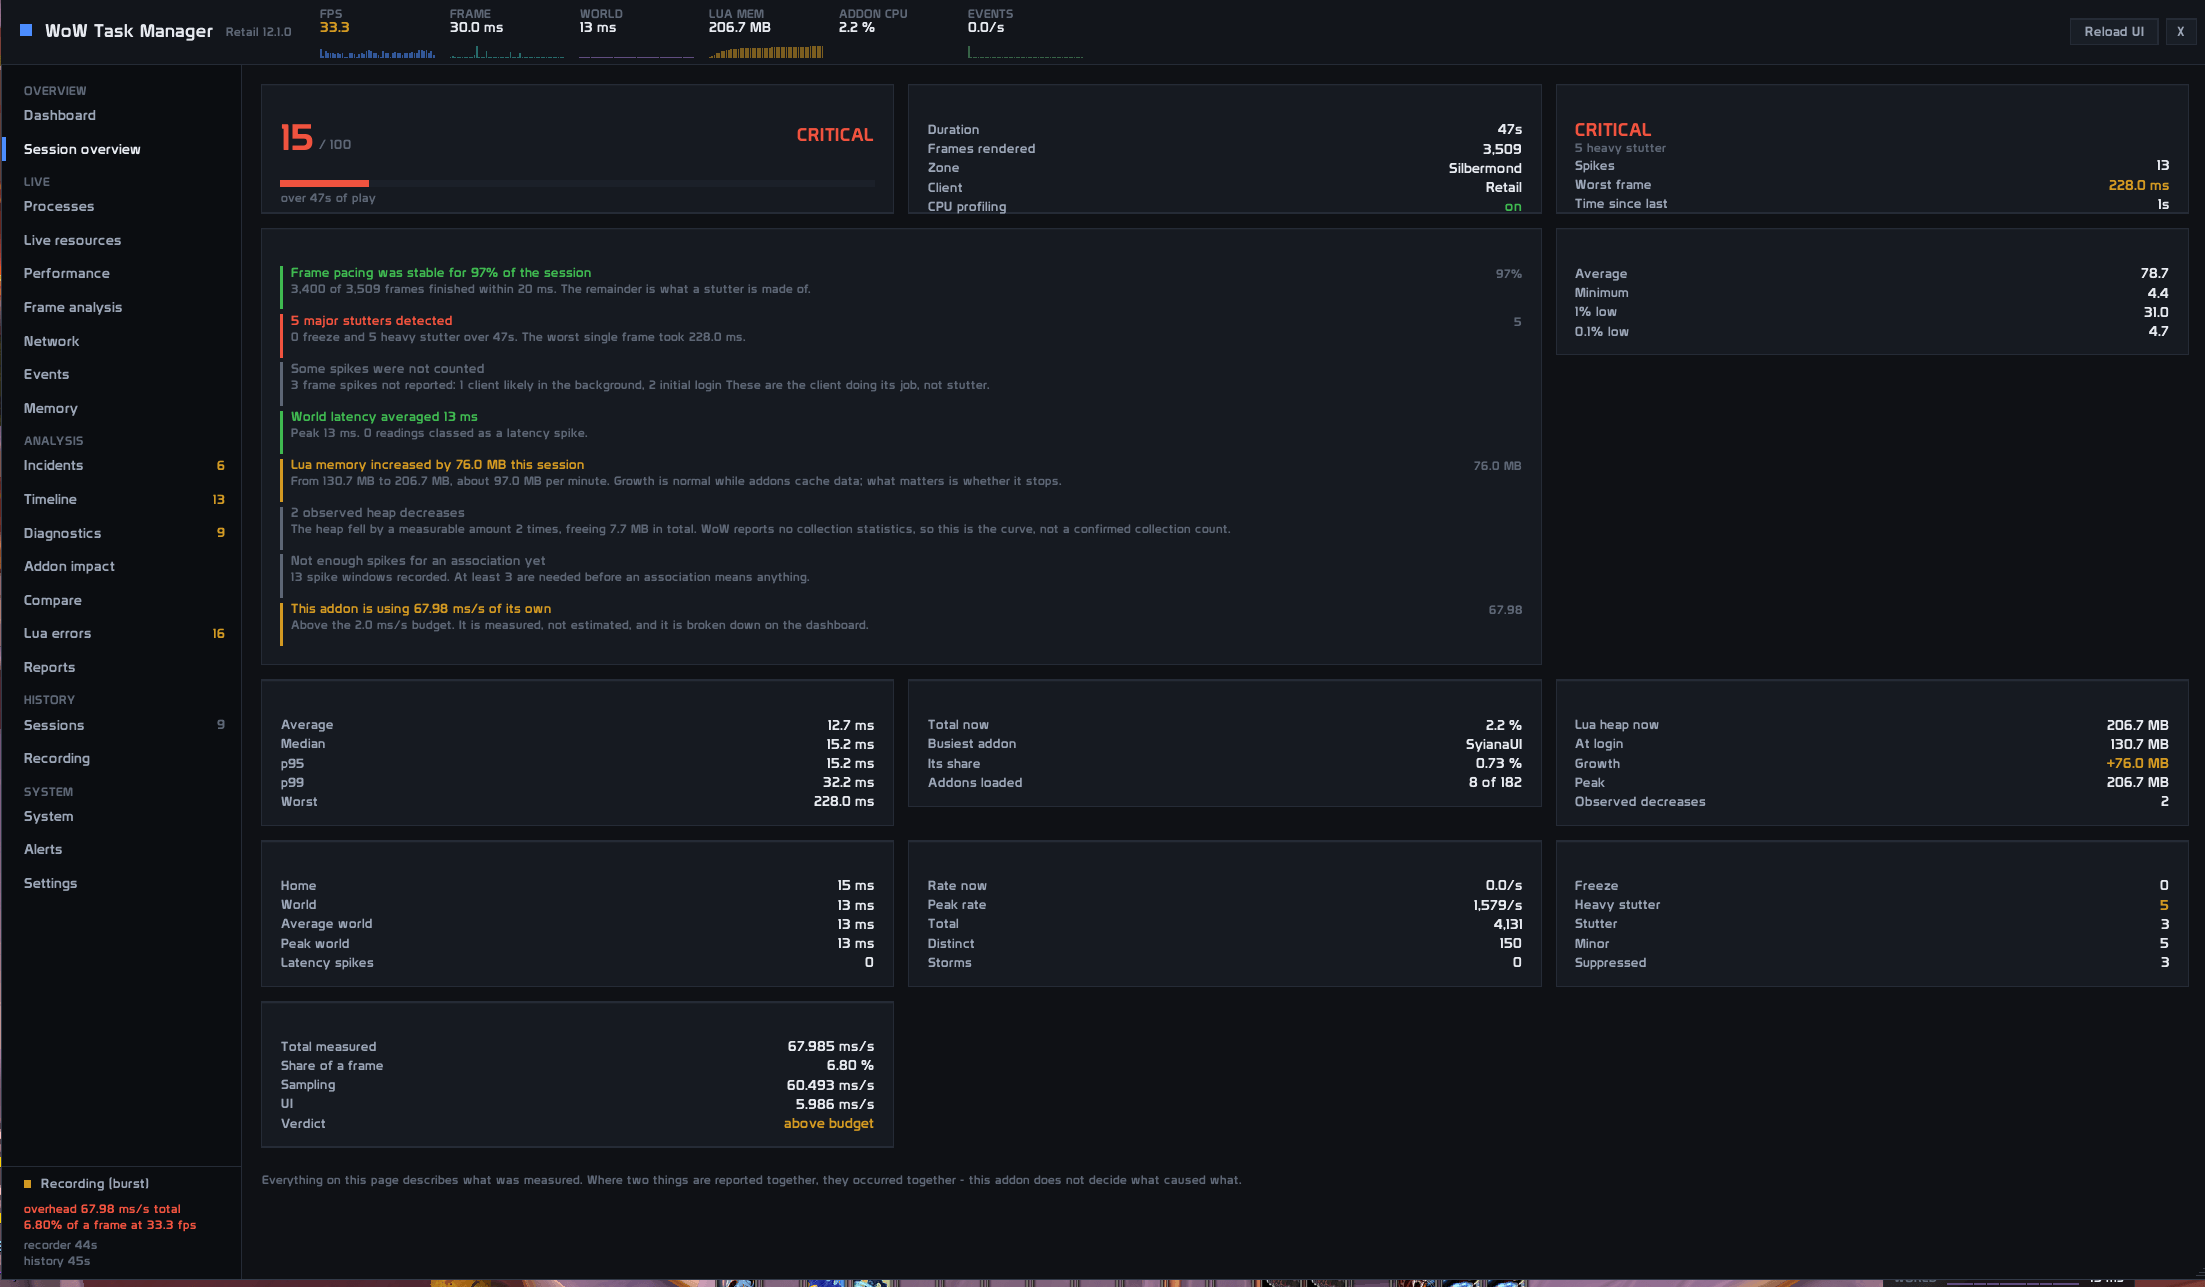
WoW Task Manager automatically identifies unusual frame-time behavior and records different types of performance disturbances.
From brief microstutters to more noticeable freezes, the addon helps you recognize performance interruptions that may not be obvious from average FPS statistics.
Repeated spikes can be grouped into stutter clusters, making it easier to recognize recurring performance instability.
Review when the interruptions occurred and examine the surrounding performance information.
🧠 Automatic Performance Diagnostics
Turn performance data into useful insights.
Collecting statistics is only the beginning.
WoW Task Manager analyzes recorded performance information and highlights possible connections between frame-time spikes, addon activity, memory behavior, and other available metrics.
Its diagnostic system helps you identify suspicious performance patterns that may deserve further investigation.
Importantly, the addon distinguishes between observed correlations and proven causes.
If an addon shows unusual CPU activity during a freeze, WoW Task Manager can highlight the relationship without falsely claiming that the addon definitely caused the problem.
Useful diagnostics. Clear information. No misleading conclusions.
💾 Advanced Memory Monitoring
Keep an eye on memory consumption and growth.
Monitor World of Warcraft's Lua memory usage alongside memory consumption from individual addons.
Track changes over time, observe session memory growth, and identify addons showing unusually high increases in memory usage.
The memory monitor also records observed decreases in allocated memory, providing additional context when examining memory behavior.
Whether you're investigating an addon that gradually consumes more memory or simply monitoring your overall UI footprint, WoW Task Manager provides detailed information in one place.
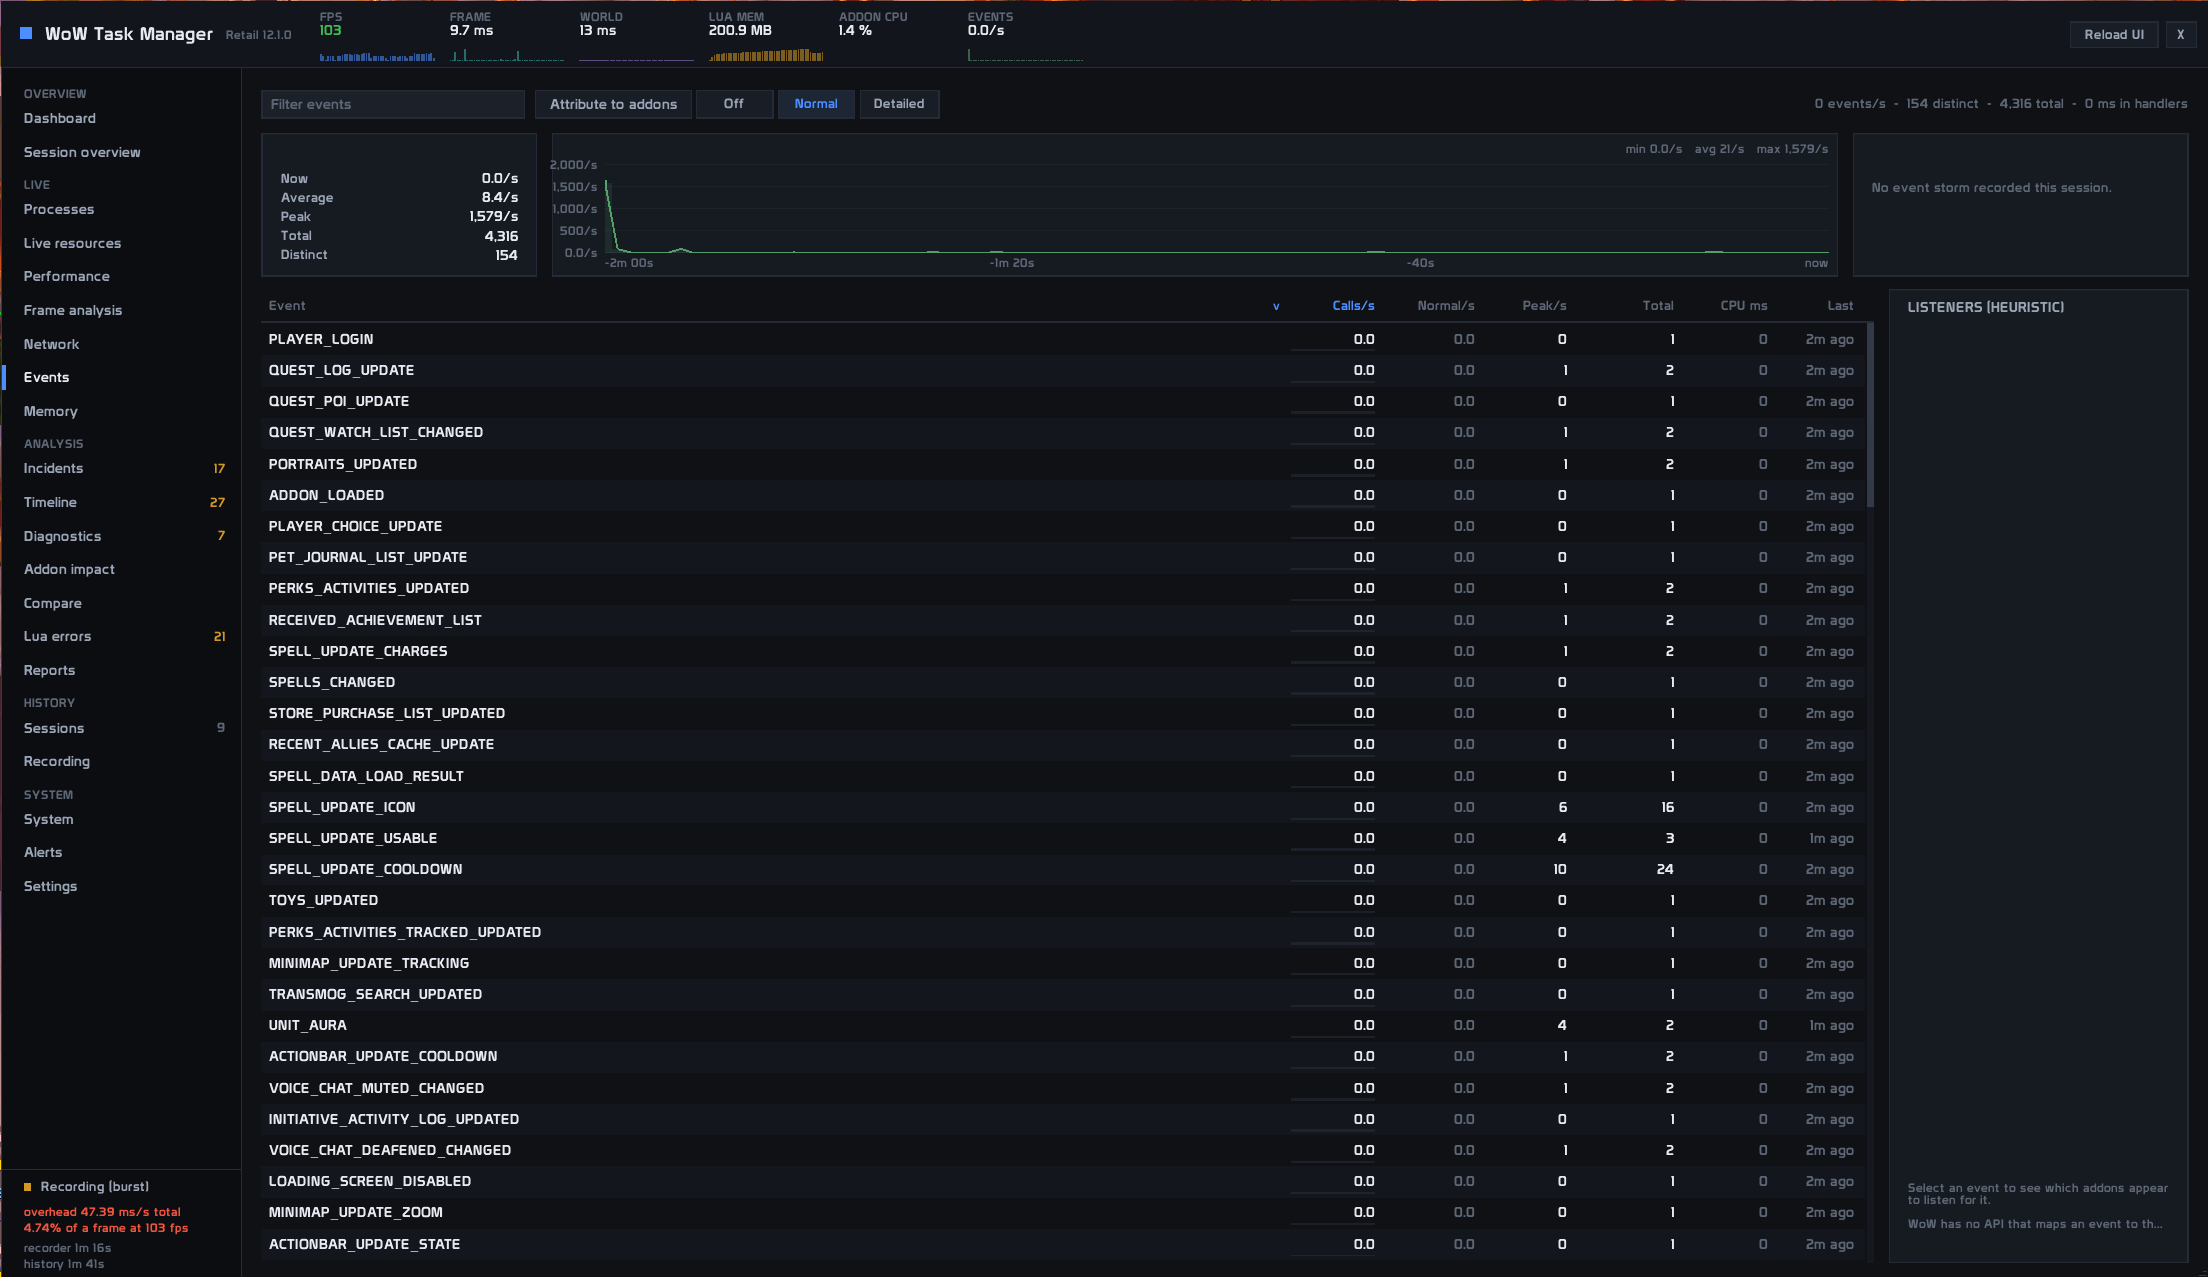
📡 Event Activity Monitor
Discover unusual bursts of addon and game event activity.
World of Warcraft relies heavily on events to update interface elements and notify addons about game activity.
Under certain circumstances, unusually frequent events can contribute to increased processing work.
WoW Task Manager monitors event rates and highlights significant bursts of activity.
This information can help identify situations that warrant further investigation during periods of reduced performance.
Event monitoring can also be configured or disabled to reduce monitoring overhead.
🖥️ Compact Live Performance Monitor
Important statistics without the full dashboard.
Don't want to keep the main interface open while playing?
Use the optional compact performance overlay to keep an eye on important metrics directly during gameplay.
Monitor your performance while questing, running dungeons, raiding, or testing addons without constantly opening the main diagnostic window.
A convenient solution for players who want quick access to essential performance information.
🗂️ Performance History & Sessions
Understand how your performance changes over time.
WoW Task Manager can save session statistics for later review.
Examine recorded average FPS, minimum FPS, 1% lows, maximum frame times, detected performance spikes, latency statistics, and available addon resource measurements.
Compare recorded results from different gameplay sessions to better understand performance behavior.
This is especially useful when investigating changes after installing addons, adjusting your interface, or modifying game settings.
🎨 Modern Desktop-Inspired Interface
Powerful diagnostics deserve a powerful interface.
WoW Task Manager features a custom-designed interface inspired by desktop performance monitoring and diagnostic applications.
Rather than relying on a traditional World of Warcraft addon configuration window, it provides a dedicated workspace for investigating performance.
The interface includes specialized views for Dashboard, Processes, Performance, Timeline, Events, Memory, Diagnostics, Sessions, System Information, and Settings.
Clear data visualization, organized sections, and an intuitive layout make complex statistics easier to understand.
🚀 Performance-Focused Monitoring
A performance monitor shouldn't become the performance problem.
WoW Task Manager is designed with monitoring efficiency in mind.
Controlled sampling intervals, pre-allocated buffers, adaptive monitoring, data downsampling, and optimized interface updates help reduce unnecessary processing work.
The addon also provides built-in overhead measurements and a benchmark mode for evaluating its own monitoring cost.
Because measuring your game's performance should introduce as little additional overhead as reasonably possible.
Built for Players, Developers & Performance Enthusiasts
🎮 Everyday Players
Experiencing unexplained lag, FPS drops, or occasional freezes?
WoW Task Manager helps you collect useful performance information and investigate what may be happening during gameplay.
You don't need to be an addon developer to benefit from understanding your game's performance.
⚔️ Raiders & Mythic+ Players
Performance matters when every second counts.
Monitor performance during demanding encounters, large fights, and fast-paced dungeon runs.
Review significant frame-time spikes and examine the available performance context to investigate interruptions during important moments.
🛠️ Addon Developers
Measure. Analyze. Improve.
WoW Task Manager provides diagnostic tools for developers who want to understand the runtime behavior of their addons.
Observe CPU activity where supported, examine memory growth, monitor event rates, and evaluate performance behavior during different gameplay situations.
Useful for development, troubleshooting, and optimization.
🖥️ UI Customization Enthusiasts
Running a heavily customized interface with dozens of addons?
Monitor resource usage and investigate possible performance bottlenecks without relying entirely on guesswork.
Understand how your addon setup behaves and make better-informed decisions about your configuration.
Supported World of Warcraft Versions
WoW Task Manager provides releases for multiple World of Warcraft editions.
World of Warcraft Retail / Midnight
World of Warcraft Forever
Mists of Pandaria Classic
Wrath / Titan Reforged Classic
Burning Crusade Classic / Anniversary
World of Warcraft Classic Era
Available performance metrics and diagnostic capabilities may differ between clients because Blizzard exposes different APIs across game versions.
When a measurement is unavailable, WoW Task Manager is designed to display that limitation rather than invent unsupported statistics.
Always select the appropriate CurseForge release for your World of Warcraft client.
Important: Addon CPU Monitoring
CPU profiling must be enabled to measure individual addon CPU usage.
World of Warcraft normally does not expose complete per-addon CPU statistics without its built-in profiling functionality.
WoW Task Manager can guide you through enabling scriptProfile and indicates when CPU profiling is unavailable.
Because CPU profiling itself introduces additional overhead, use it when detailed CPU diagnostics are needed rather than assuming continuous profiling is al
WoW Task Manager Team

Owner