Valence Benchmark
- By
A benchmark that costs nothing to run. Records 10 minutes of frametimes, chunks, entities, CPU/GPU/RAM and server ticks with zero allocation on the render thread, then writes a full HTML and text report.
Capture d'écran 2026-08-15 190614.png
Valbench1.png
Description
Valence Benchmark
A benchmark for Minecraft that costs nothing to run.
Minecraft 1.21.1 · Fabric · client-side only · by ceketrumdev
Most in-game benchmarks change the thing they measure. They draw an overlay, they log to disk, they allocate on the render thread, and the stutter they report is partly their own.
Valence Benchmark records a 10 minute window in which it does none of that. One
System.nanoTime(), two compares and two array writes per frame, into buffers allocated
before the clock starts. No overlay, no logging, no garbage collection, no screenshots while
the window is open. Then, once the clock has stopped, it writes a full report.
It does not ask you to take that on faith. The report prints the mod's own cost — in
nanoseconds and in bytes allocated, per frame — measured on the render thread at the start of
every single run. The allocation figure should read 0.00.
Quick start
1.  Join a world and stand still for a few seconds
2.  /valence bench start
3.  Play normally for 10 minutes
4.  Click the report link in chat
That is the whole workflow. The run ends on its own; you never have to stop it.
Commands
Everything lives under /valence. All commands are client-side — they are handled by
your game and never reach a server — with one exception noted below.
| Command | Arguments | What it does |
|---|---|---|
/valence bench start |
— | Warms up, then measures for 10 minutes |
/valence bench stop |
— | Cancels the warm-up, or ends a running measurement early |
/valence bench status |
— | Current state, progress, link to the last report |
/valence bench open |
— | Clickable link to the last report |
/valence bench |
— | Same as status |
/valence world |
— | Last world load time measured |
/valence scene entities |
<count> [type] [radius] |
Builds a reproducible entity scene |
/valence scene clear |
— | Removes the scene |
/valence bench start
Prints a short countdown, then opens the measurement window. During warm-up the mod allocates its buffers, starts the hardware probes, takes a reference screenshot and forces a garbage collection, so the window itself starts from a clean heap.
Refuses to start if you are not in a world (the chunk and entity metrics need one), if a run is already going, or if a scene is still being built.
Once the window is open, nothing is drawn or logged until it closes. Play normally.
/valence bench stop
During warm-up, cancels. During a run, ends it early and still writes a report — clearly marked partial, because a 3 minute run and a 10 minute run are not comparable.
/valence bench status
Idle: the last world load time and a link to the last report. Running: elapsed, remaining, frames recorded so far, chunks received so far.
/valence world
The last world load time on its own. This measurement runs continuously, independently of any benchmark — join a world, stand still, and the mod times it without being asked.
/valence scene entities <count> [type] [radius]
| Argument | Range | Default |
|---|---|---|
count |
1 – 20000 | required |
type |
any entity id, e.g. minecraft:zombie |
minecraft:zombie |
radius |
1 – 256 blocks | 16 |
/valence scene entities 300
/valence scene entities 300 minecraft:zombie
/valence scene entities 300 minecraft:zombie 24
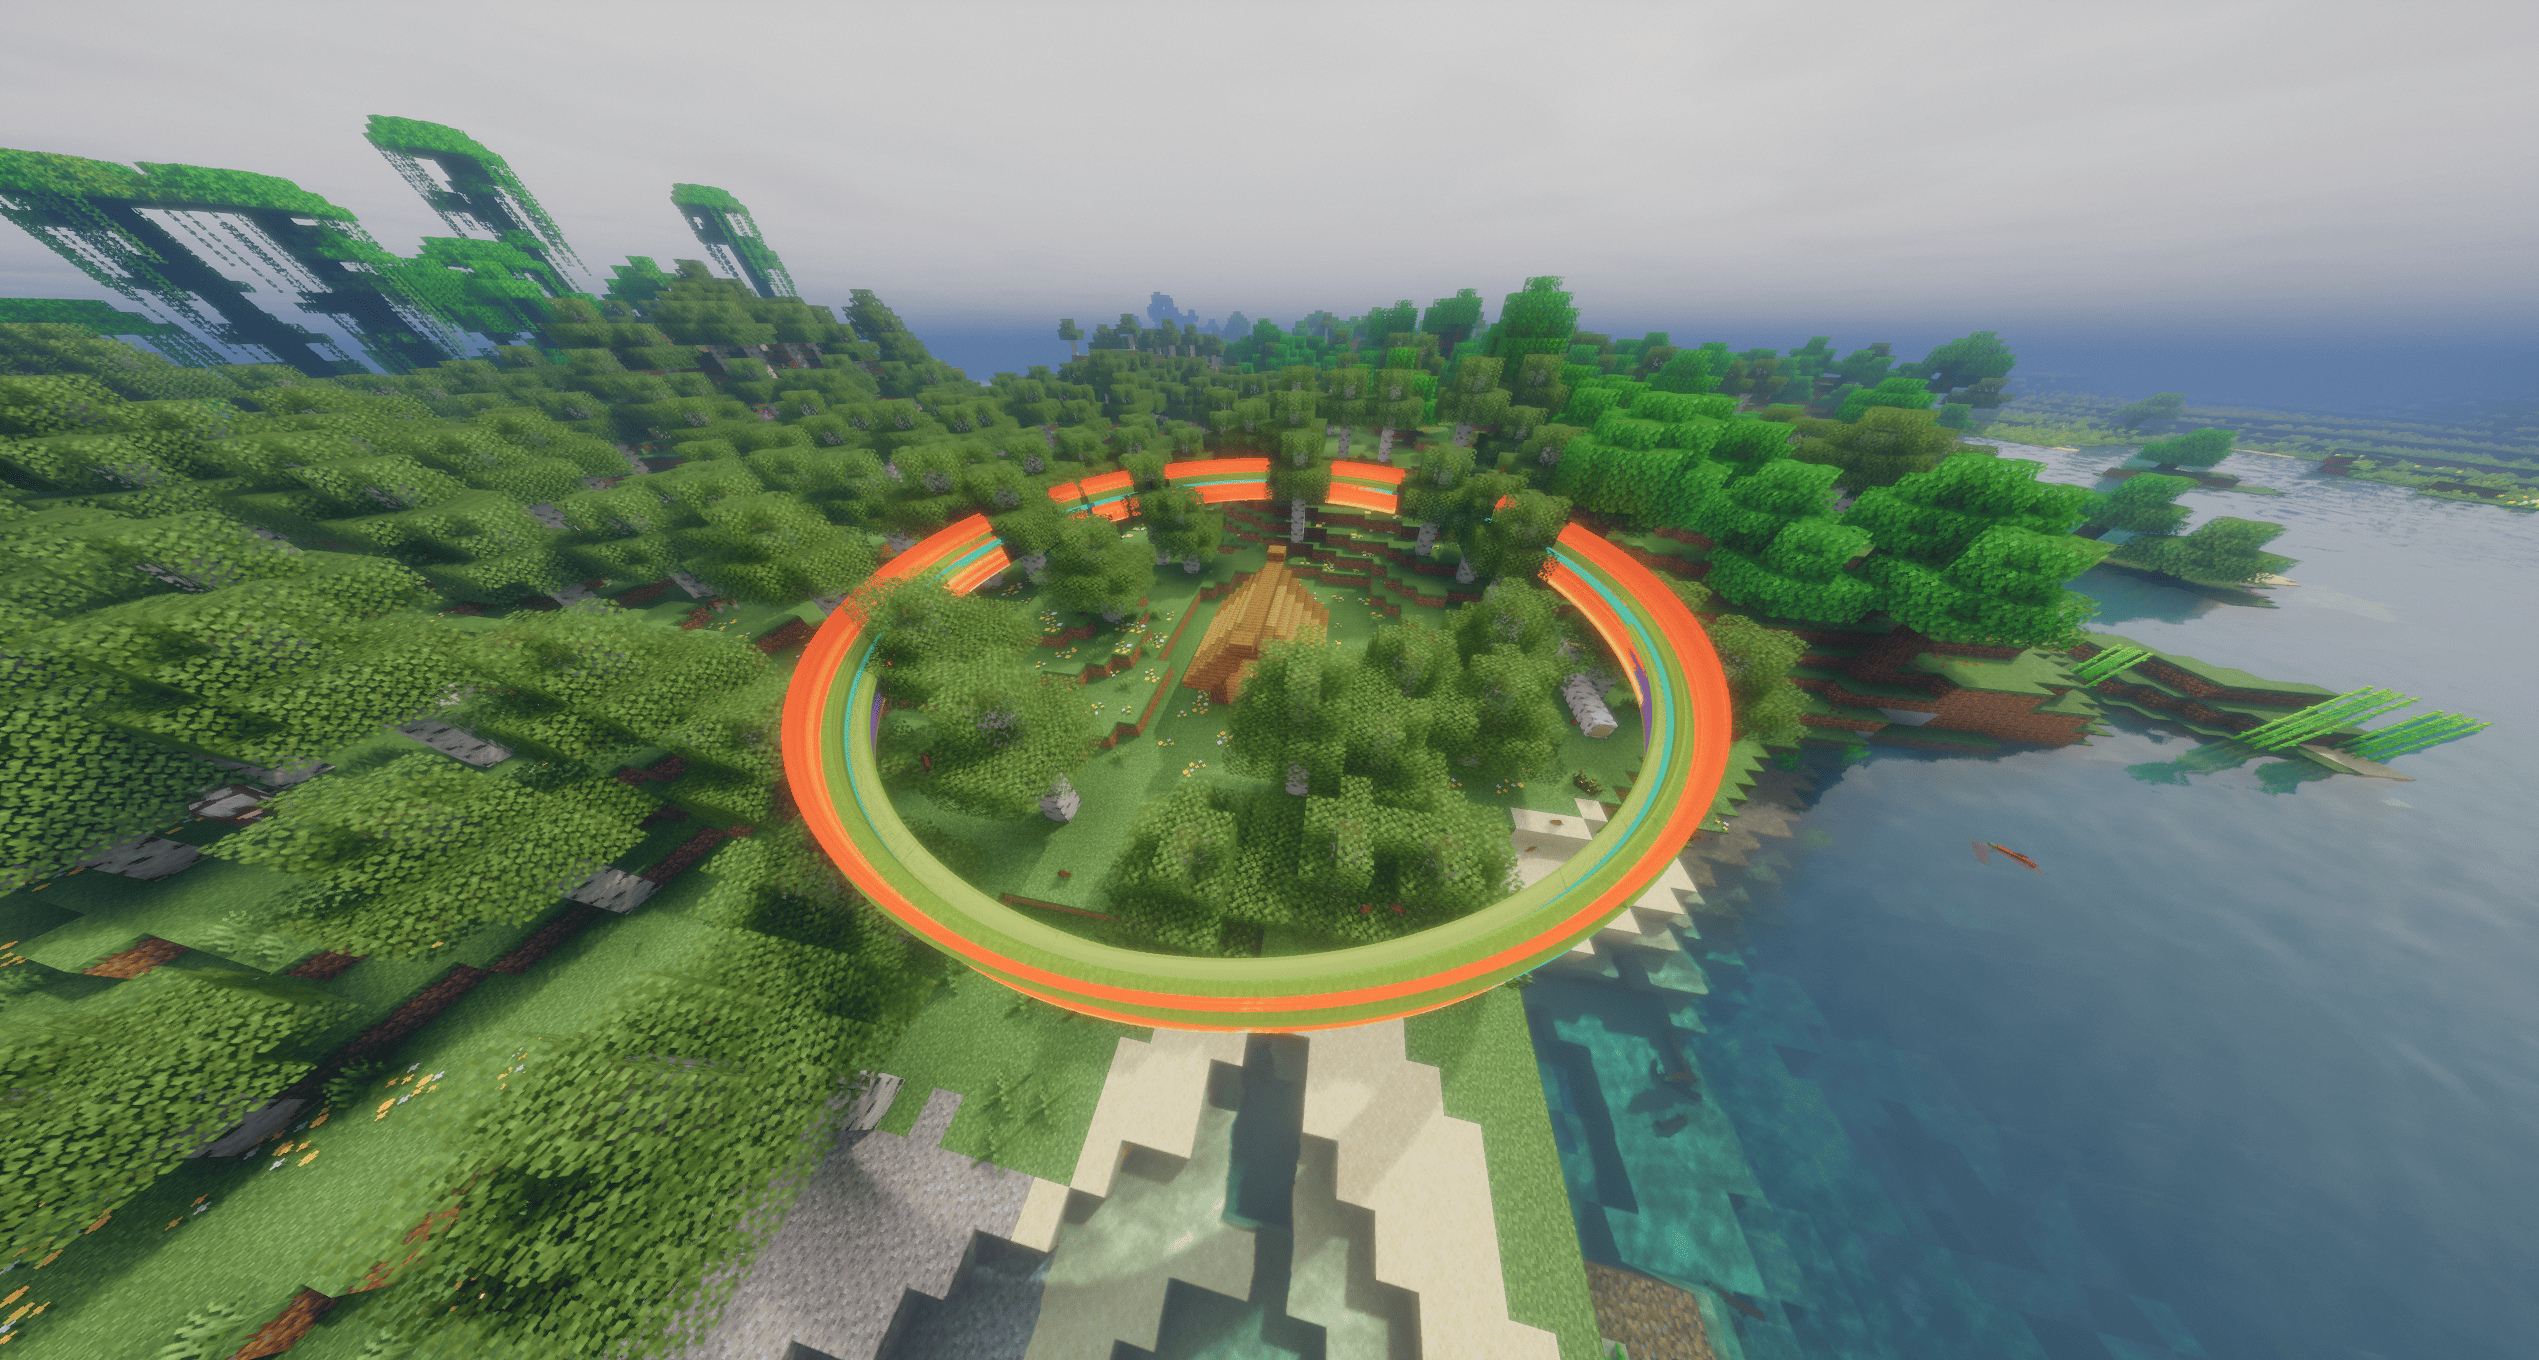
Summons count entities on a ring of the given radius around you, at your own Y level. Every
entity is at the same distance, so every one of them is at the same level of detail and
the same cull state — the only variable left is how many there are.
They spawn with NoAI, NoGravity, Silent, Invulnerable and PersistenceRequired, and
carry the tag valence_bench. Nothing walks off, falls, despawns, makes noise or dies. Run
the same command tomorrow and you get the same scene.
This is the one command that touches the server. It sends ordinary
/summoncommands on your behalf, so it needs cheats in singleplayer or op on a server. They are sent 20 per tick so a server does not kick you for spam.radiuscan only be given iftypeis given too.
/valence scene clear
Runs kill @e[tag=valence_bench] — it removes exactly what the scene command placed, and
nothing you built.
What you get
Reports are written to .minecraft/valence-benchmark/:
| File | What it is |
|---|---|
valence-<timestamp>.html |
The full report. Charts, interactive, works offline forever |
valence-<timestamp>.txt |
The same content as plain text, pasteable into an issue or a spreadsheet |
valence-<timestamp>.json |
The raw data |
valence-<timestamp>-golden-start.png / -golden-end.png |
Reference frames |
latest.html / latest.txt |
A copy of the most recent run |
The HTML report
Headline figures first, then the details grouped by category:
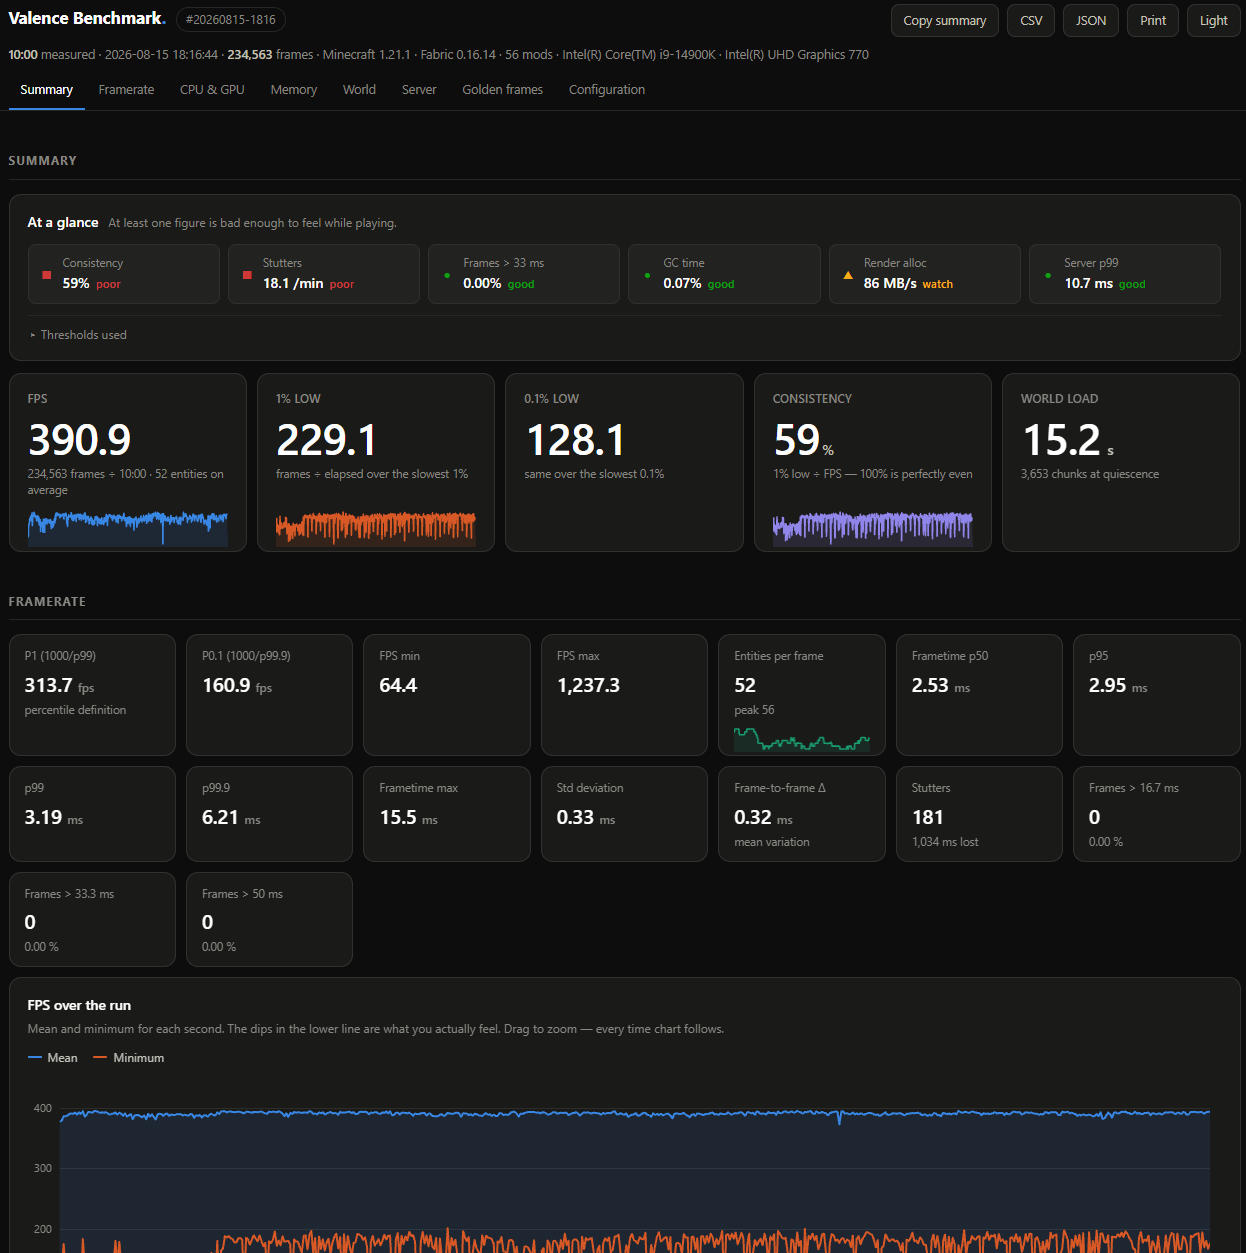
Summary — an At a glance strip grading consistency, stutter, GC pressure, allocation rate and server tick time, each shown with the threshold it was compared against so the grade can be audited rather than trusted. Then FPS, 1% low, 0.1% low, consistency and world load time, each with its own trend line.
Framerate — percentiles, stutter counts, the distribution, FPS over time, and FPS by entity count: the load-to-framerate relation actually measured on this run.
CPU & GPU — system and process load, GPU utilisation, VRAM, temperatures, power, clock.
Memory — heap, off-heap, process RSS, GC, and Java allocation on the render thread.
World — chunk load times, throughput, chunks held, client entities.
Server — the full integrated-server picture (see below).
Golden frames — the two reference screenshots, so you can verify that two runs you are comparing were actually drawing the same scene.
Configuration — machine, GPU, driver, Java flags, every video setting, the full mod list.
Drag across any time chart to zoom, and all seventeen of them follow to the same instant — spot a drop at 4:10 on the framerate curve and immediately see what the CPU, the GPU, the heap and the chunk loader were doing during those fifteen seconds. There is a Copy summary button that puts a markdown table on your clipboard, a CSV export, and a print stylesheet for a clean PDF.
What is measured
Frames — the raw frametime of every frame, in nanoseconds, never clamped. A 4 second hitch stays a 4 second hitch. Median, p95, p99, p99.9, max, standard deviation, frame-to-frame variation, stutter count and time lost to stutter.
Entities, per frame — the client entity count is recorded on every frame, next to its frametime. A framerate without the entity count it was measured at is not comparable to anything.
World load time — from arriving in the world until the chunk counter stops moving. This is
the most portable comparable number a Minecraft benchmark can produce, because it needs to
know nothing about the renderer: ClientChunkManager is vanilla whatever you install on top
of it.
Chunks — decode and apply time for every chunk received, throughput, chunks held over time.
Integrated server — the real duration of every tick: min, p1, median, p95, p99, p99.9,
max, standard deviation, a full distribution, ticks over 20/33/50 ms, how much of the 50 ms
tick budget the average tick uses, and the total time spent past it. Loaded chunks and
entities in total and per dimension. TPS is ticks actually observed ÷ elapsed time — not
1000 ÷ MSPT, which cannot see a tick that was skipped outright. Both are shown, side by side.
Machine — CPU load (system and Minecraft's share), GPU load, VRAM, temperatures, power, clocks, heap, off-heap, process RSS, system memory, threads, GC.
Java allocation on the render thread — sampled per thread and differentiated into MB/s. This rate, not the heap size, is what decides whether a configuration will stutter on GC.
Heap actually retained — measured after a forced collection, once the window has closed. The heap curve shows allocation pressure; this one number shows the real footprint.
Reading the numbers
FPS is frames ÷ elapsed time. Never a mean of instantaneous framerates — that weights fast frames more heavily and reports a number nobody experienced. The same rule holds inside every second and every entity bucket.
Two definitions of "1% low" circulate and they do not agree:
| 1% low | frames ÷ elapsed over the slowest 1% of frames |
| P1 | 1000 ÷ the 99th percentile frametime |
The first is more sensitive to big drops, the second is more stable. Both are in the report. Compare the same row between runs.
Consistency is 1% low ÷ FPS. At 100% the game is perfectly even; below 60% the stutter
is felt even when the average looks flattering.
A run is only comparable to a run made under the same conditions: same world, same route or scene, same settings, same mods, same entity count. The report records all of it — and the golden frames let you check with your own eyes.
Requirements
- Minecraft 1.21.1
- Fabric Loader 0.16 or newer
- Fabric API
- Java 21 (already required by 1.21.1)
Client-side only. Works in singleplayer and on servers; the server metrics are filled in for singleplayer, where the integrated server runs in the same process.
GPU load needs nvidia-smi on the PATH (default with the NVIDIA drivers) or, on Linux with
an AMD card, the gpu_busy_percent counter the amdgpu driver already exposes. Without
either, everything else still works and GPU load reads n/a.
Configuration
.minecraft/config/valence-benchmark.json, created on first launch. The defaults are what
you want; the ones worth knowing:
| Key | Default | Effect |
|---|---|---|
durationSeconds |
600 |
Length of the measurement window |
warmupSeconds |
5 |
Quiet period before the clock starts |
frameBufferMaxFps |
1500 |
Sizes the frame buffer — raise it if you run above 1500 fps |
gpuProbe |
"auto" |
auto, nvidia-smi, sysfs, off |
cpuTemperature |
"auto" |
On everywhere except Windows, where the WMI query needs admin and usually fails |
goldenScreenshots |
true |
Capture before and after the window |
progressMessages |
false |
A progress line each minute — off, because a chat message costs a text layout |
autoOpenReport |
false |
Open the report in your browser when the run ends |
🖥️ Recommended Server Hosting
⚡ Need a Minecraft Server?
Looking for high-performance, reliable, and low-latency hosting for your Minecraft server? I personally recommend Anda Cloud! Whether you are running a heavy technical modpack or a custom multiplayer server, Anda Cloud provides top-tier hardware to keep your game running smoothly without TPS drops.

Credits
Valence Benchmark by ceketrumdev. MIT licence.
Valence Benchmark Team