MineMetrics
- By
A mod to export your dedicated servers metrics. Built to be used with Prometheus and Grafana as your data collection & visualization layers.
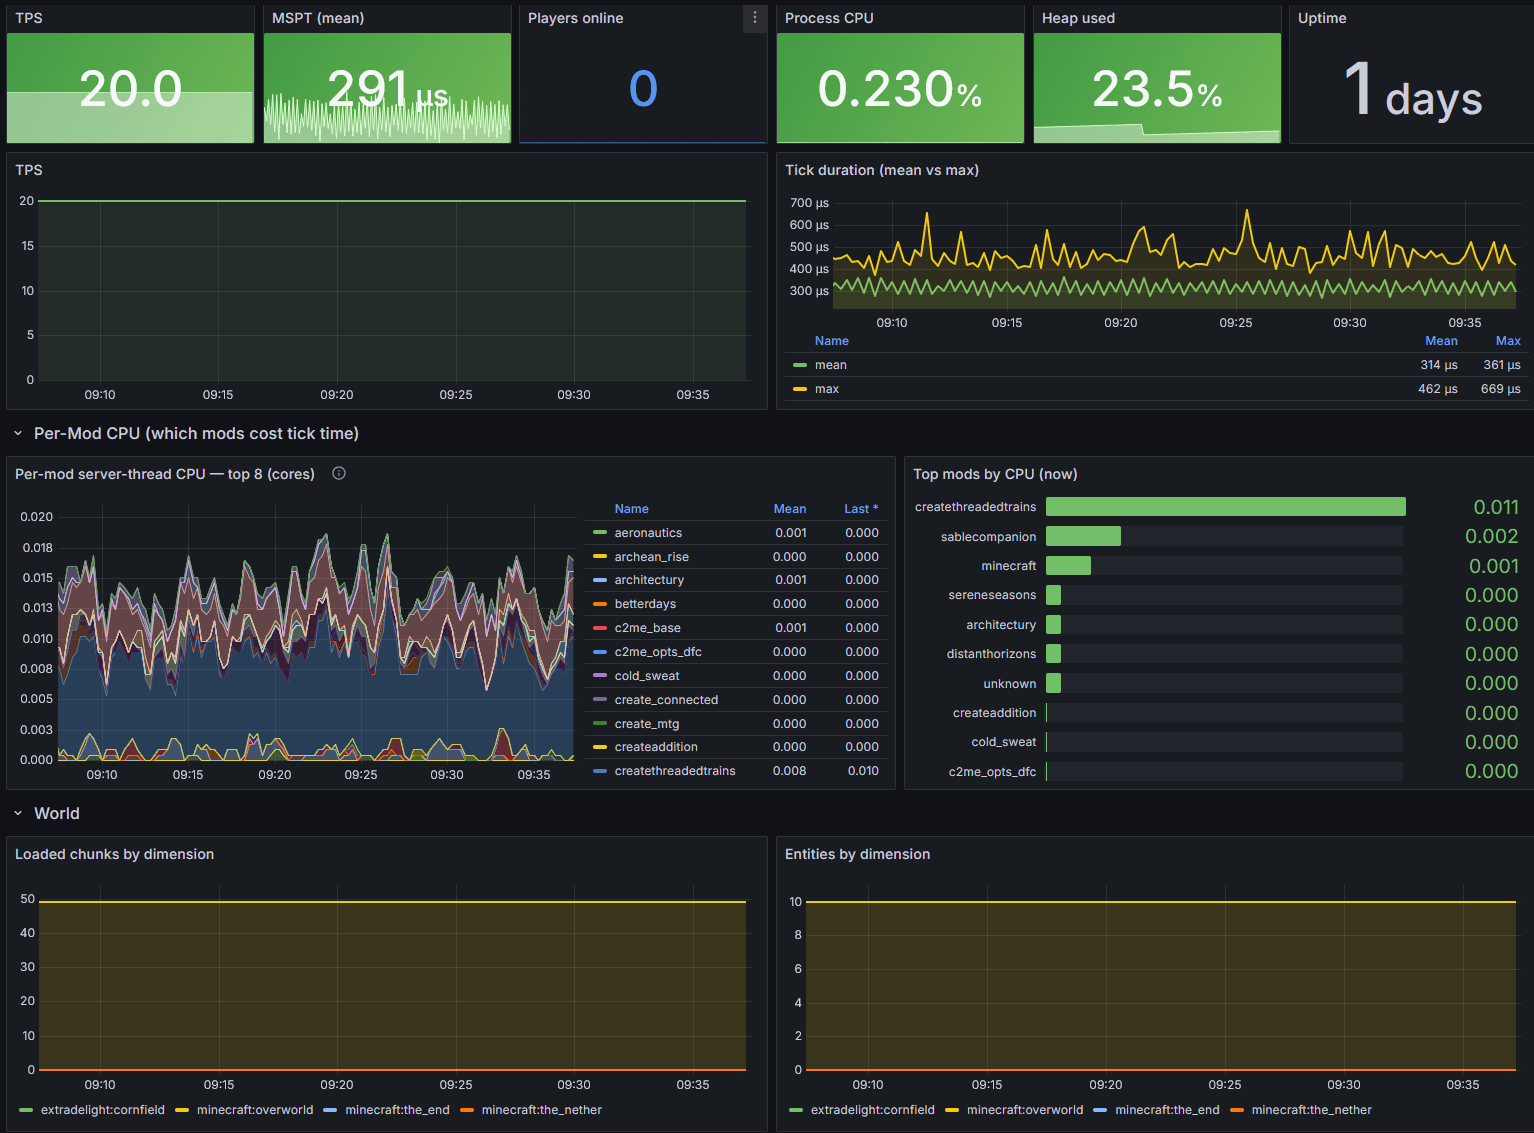
Screenshot 2026-07-20 093739.png
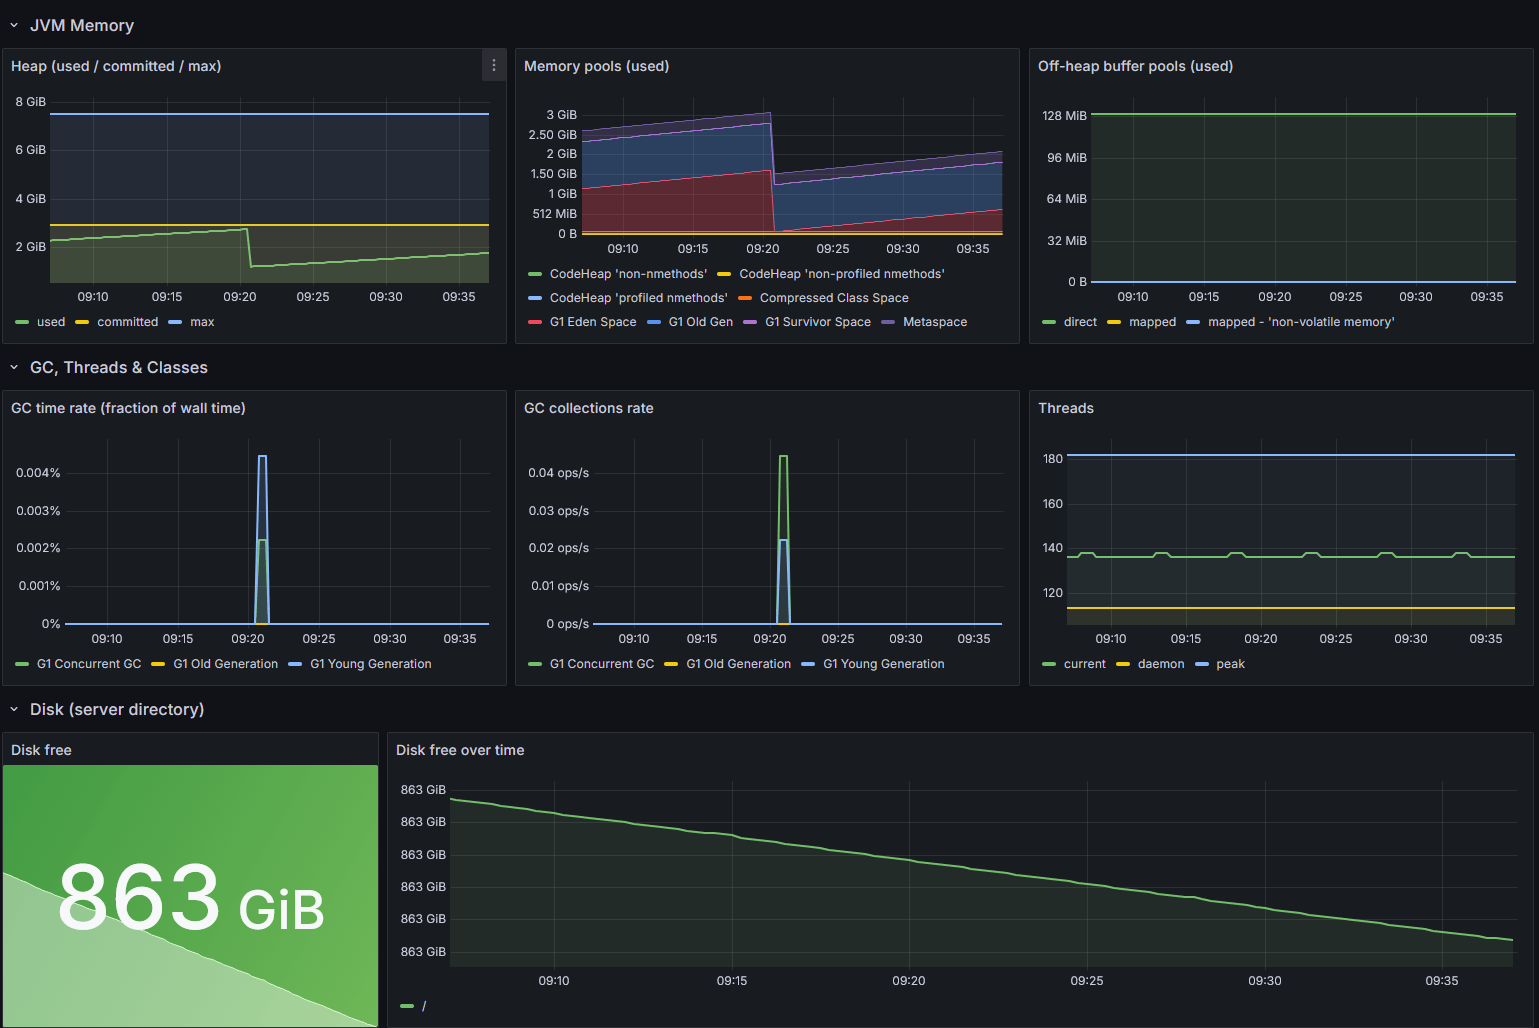
Screenshot 2026-07-20 093713.png
Description
MineMetrics
A lightweight server-side NeoForge mod for Minecraft 1.21.1 that turns your
server into a live Prometheus metrics source. Drop it into your mods/
folder and it serves a /metrics endpoint (default 0.0.0.0:19565) that any Prometheus instance
can scrape — no third-party libraries bundled, no client-side install, and negligible impact on
your tick rate.
It exposes the numbers that actually explain server performance:
- Ticks: TPS, mean/max MSPT, and cumulative tick counters
- World: loaded chunks, entities (with an optional per-type breakdown), and players — per dimension
- JVM: heap/non-heap and per-pool memory, off-heap buffers, garbage collection, threads, class-loading, and JIT
- Host: process & system CPU, total/used system RAM, and free disk space on the server drive
The standout feature is per-mod CPU attribution. A built-in sampling profiler continuously
watches the server thread and reports how much CPU each installed mod is consuming
(minecraft_mod_cpu_seconds_total{mod="..."}) — capturing event handlers, block-entity ticking,
and mixins alike. When your server starts to lag, you can finally see which mod is responsible,
straight from your dashboards, without running a manual profiler.
Configuration
A companion Docker Compose stack (Prometheus + Grafana with pre-built, easy-to-read dashboards) is available so you can go from install to graphs in minutes — see the monitoring stack repo ( https://github.com/hxxp-rhys/MineMetrics ). Everything is configurable: bind address, port, sampling rate, and optional metrics, with player identities kept opt-in for privacy.
License
MIT-licensed and 100% dependency-free.
The MineMetrics Team